Inspector Features
Inspector Tracing
Prysm supports a large portion of the features in the “Performance” tab of the Chrome Inspector. Some of them work is a slightly different manner compared to Chrome and here we want to outline how can one do performance traces of Cohtml and reason about the gathered results.
Starting a trace is done through the “Record” button on the top bar in the “Performance” tab.
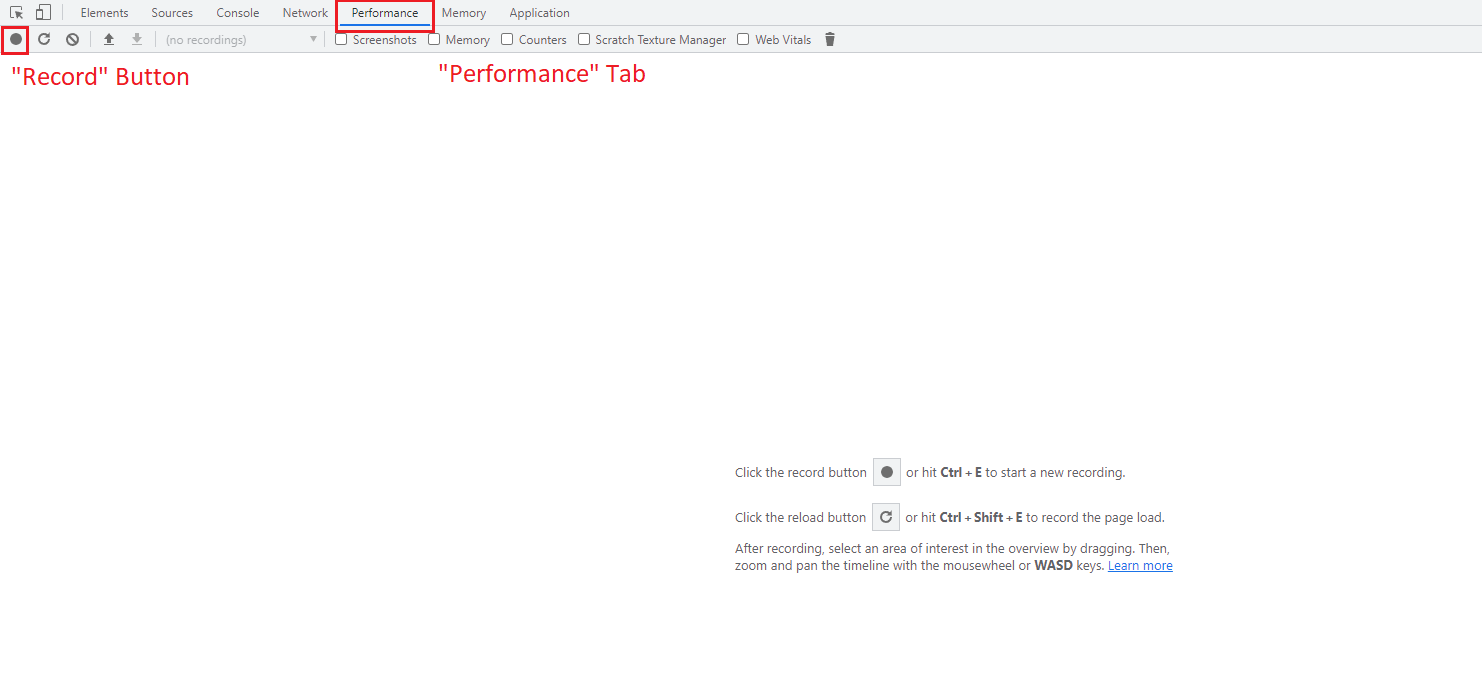
In the following sections, we’ll go through several aspects of the recorded traces and explain what problems can the trace data reveal about a given page.
Rendering Trace markers
Internally Prysm uses the proprietary rendering library Renoir (also developed by Coherent Labs). The library takes primitive rendering commands for drawing basic shapes and generates graphics API calls that do the actual rendering through the GPU. The rendering of a page is a heavy operation and knowing how long the rendering takes is essential in understanding the performance implications of your UI. Thanks to the inspector’s tracing capabilities we have the ability to see Renoir’s internal markers being traced and displayed on the timeline
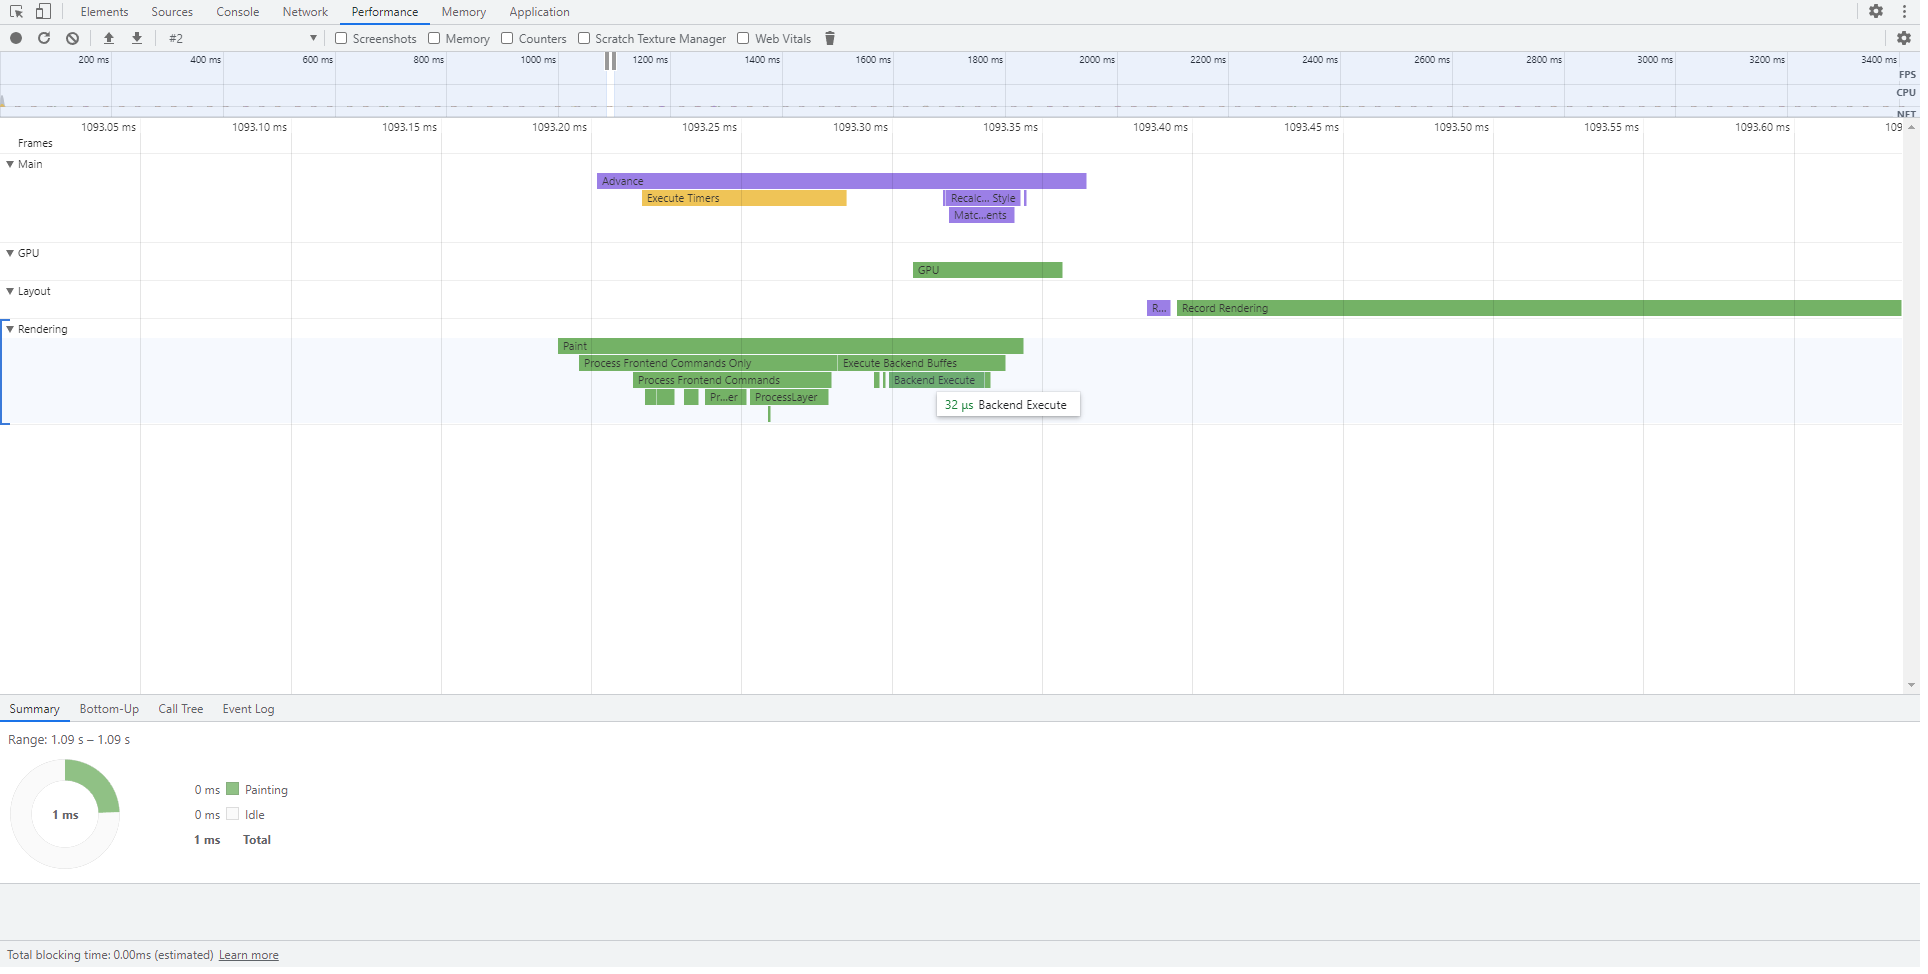
These markers can give better insights into the performance characteristics of the rendering library for a given page.
Some of the markers make sense only to Cohtml’s developers but others are helpful to the clients as well. We’ll give a brief explanation of the major markers to be aware of.
- “Paint” - the top-level marker of all rendering-related work. This is essentially the time that Cohtml spends in
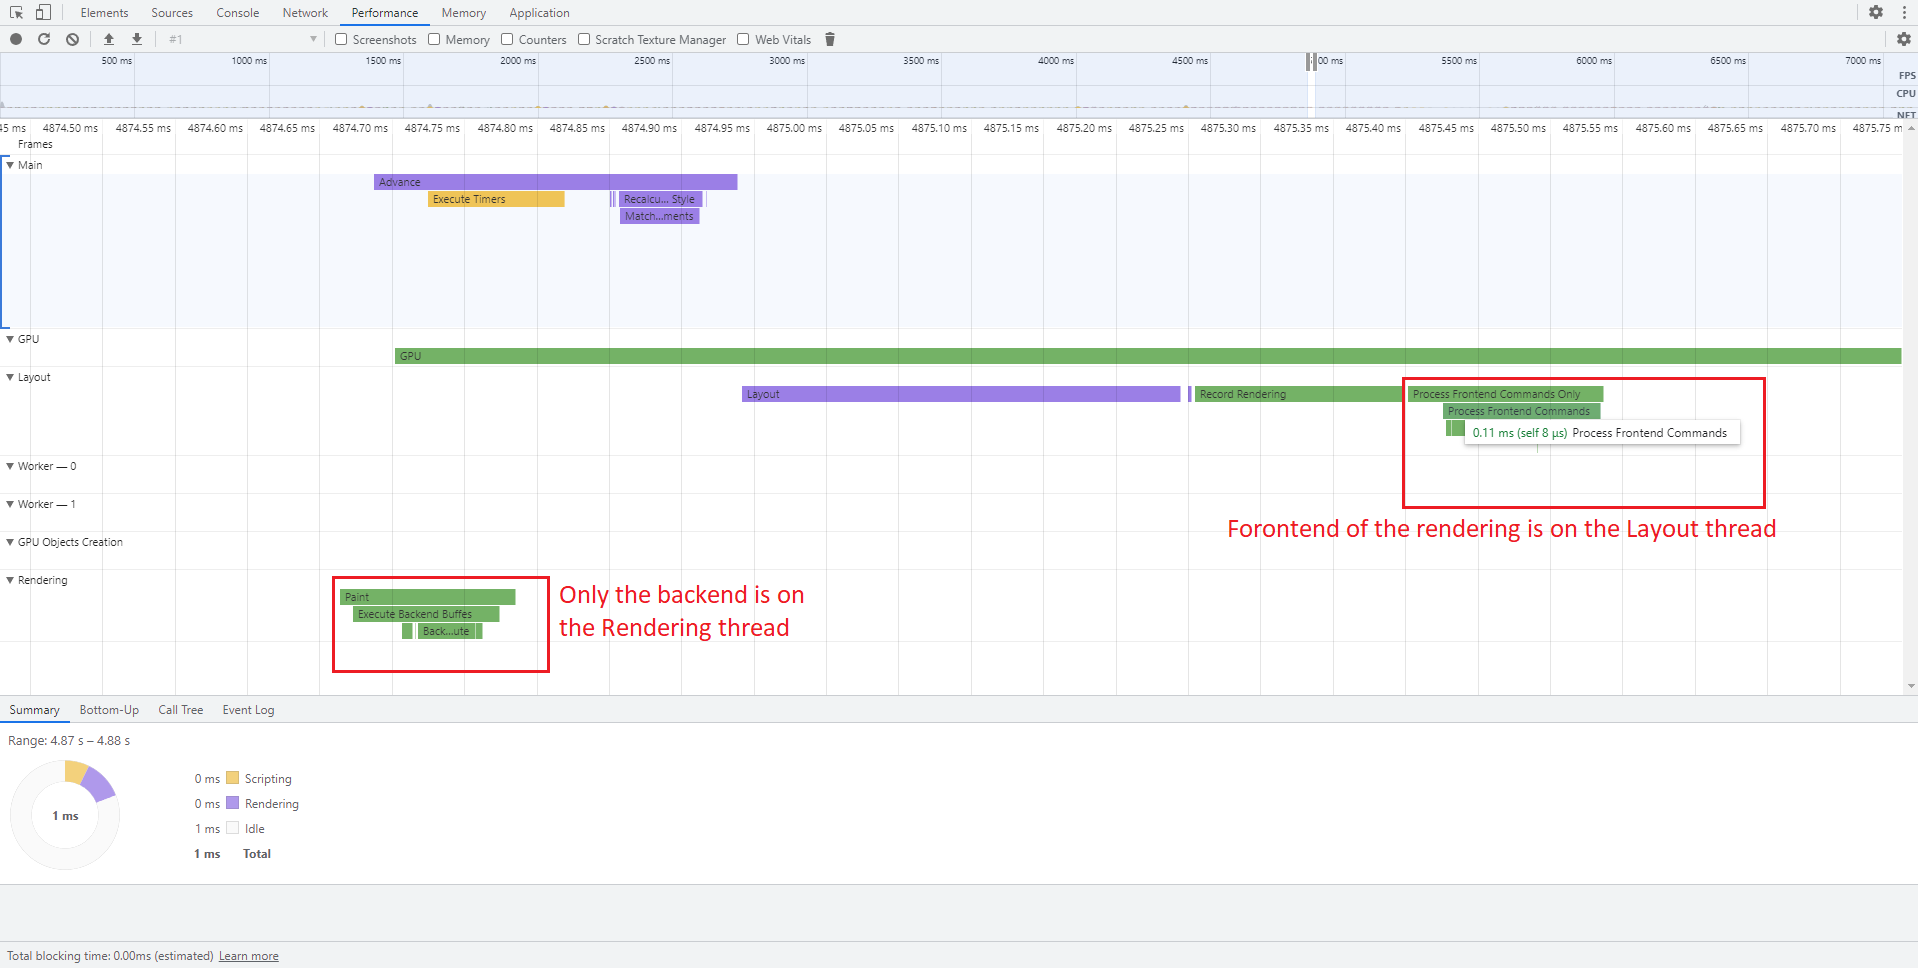
ViewRenderer::Paint - “Process Frontend Commands Only” - the work during rendering is divided into two big groups - frontend (where we decide what graphics API calls we need) and backend (where we do the actual interaction with the graphics API). This marker is for the time we spend in the frontend.
- “Execute Backend Buffers” - the actual execution of the generated graphics API commands.
- “Batch Commands” - during this time Renoir decides which draw commands can be done in a single draw call
- “Process Layer” - the generation of backend command for each layer in the page. Cohtml creates a separate layer for each group of elements that need to be drawn together in their parent layer. This happens when there is some filter, opacity, or blend mode applied to a DOM node.
These are the main spots to keep an eye on for potentially performance problems when it comes to the rendering. The concrete time values of the markers can vary based on the complexity of the UI but it is a good idea to consider them during UI development to quickly identify performance issues.
A very useful feature is the ability to relate some trace markers (“Process Layers” for example) to the DOM node that is responsible for it. Simply hovering a “Process Layer” marker will highlight the DOM node in question that has been drawn in it. The highlighting happens in the corresponding view’s viewport. Clicking on it and inspecting the “Node” field in the summary tab below will show you exactly which node is this event for. Clicking on the link itself will even bring you to the node in the “Elements” tab.
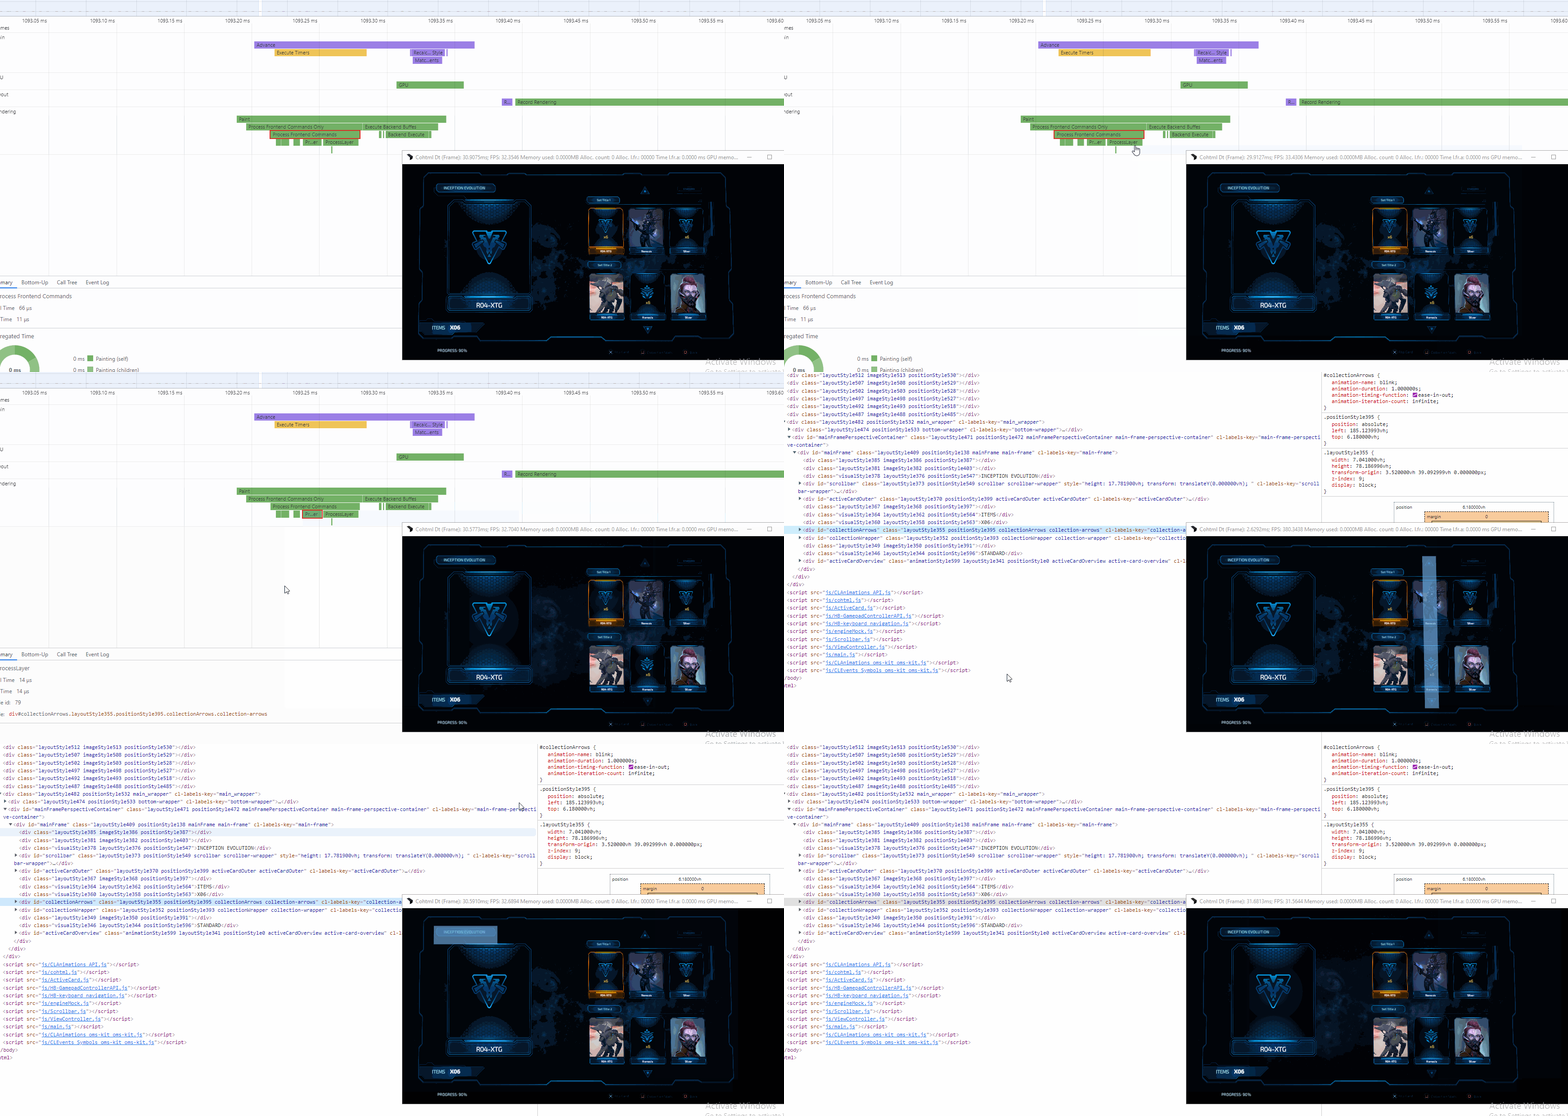
All of this allows you to quickly identify the node responsible for a given layer. This way you can reason about which parts of your UI are taking the most time to be drawn.
The rendering markers are also thread-aware. If the inspected view was initialized with ViewSettings::ExecuteCommandProcessingWithLayout set to true, the frontend command will be executed on the Layout thread, just after “Layout” and “RecordRendering” have finished. This can be made visible thanks to the rendering markers.
Object creation and destruction markers
Renoir tries to minimize the GPU object creations (textures, index and vertex buffers, and constant buffers) by reusing already created resources. In some situations, however, this is not possible with the default capacity of the internal caches. It is crucial to know when a UI is causing some cache to be thrashed and constant recreation of objects (most often textures) is happening.
To address this issue, we’ve introduced trace markers that mark the creation and destruction of different GPU objects. Currently, you can see when a texture, vertex, or index buffer is created and destroyed. The trace markers are as follows:
- Texture Create/Destroy - for textures
- VB Create/Destroy - for vertex buffers
- IB Create/Destroy - for index buffers
These events also carry some meta information about the object that has been created. Most notably, this is the type of object which give information about the object usage. These types can be inspected by clicking on the corresponding event and examining the “Type” field in the “Summary” tab below.
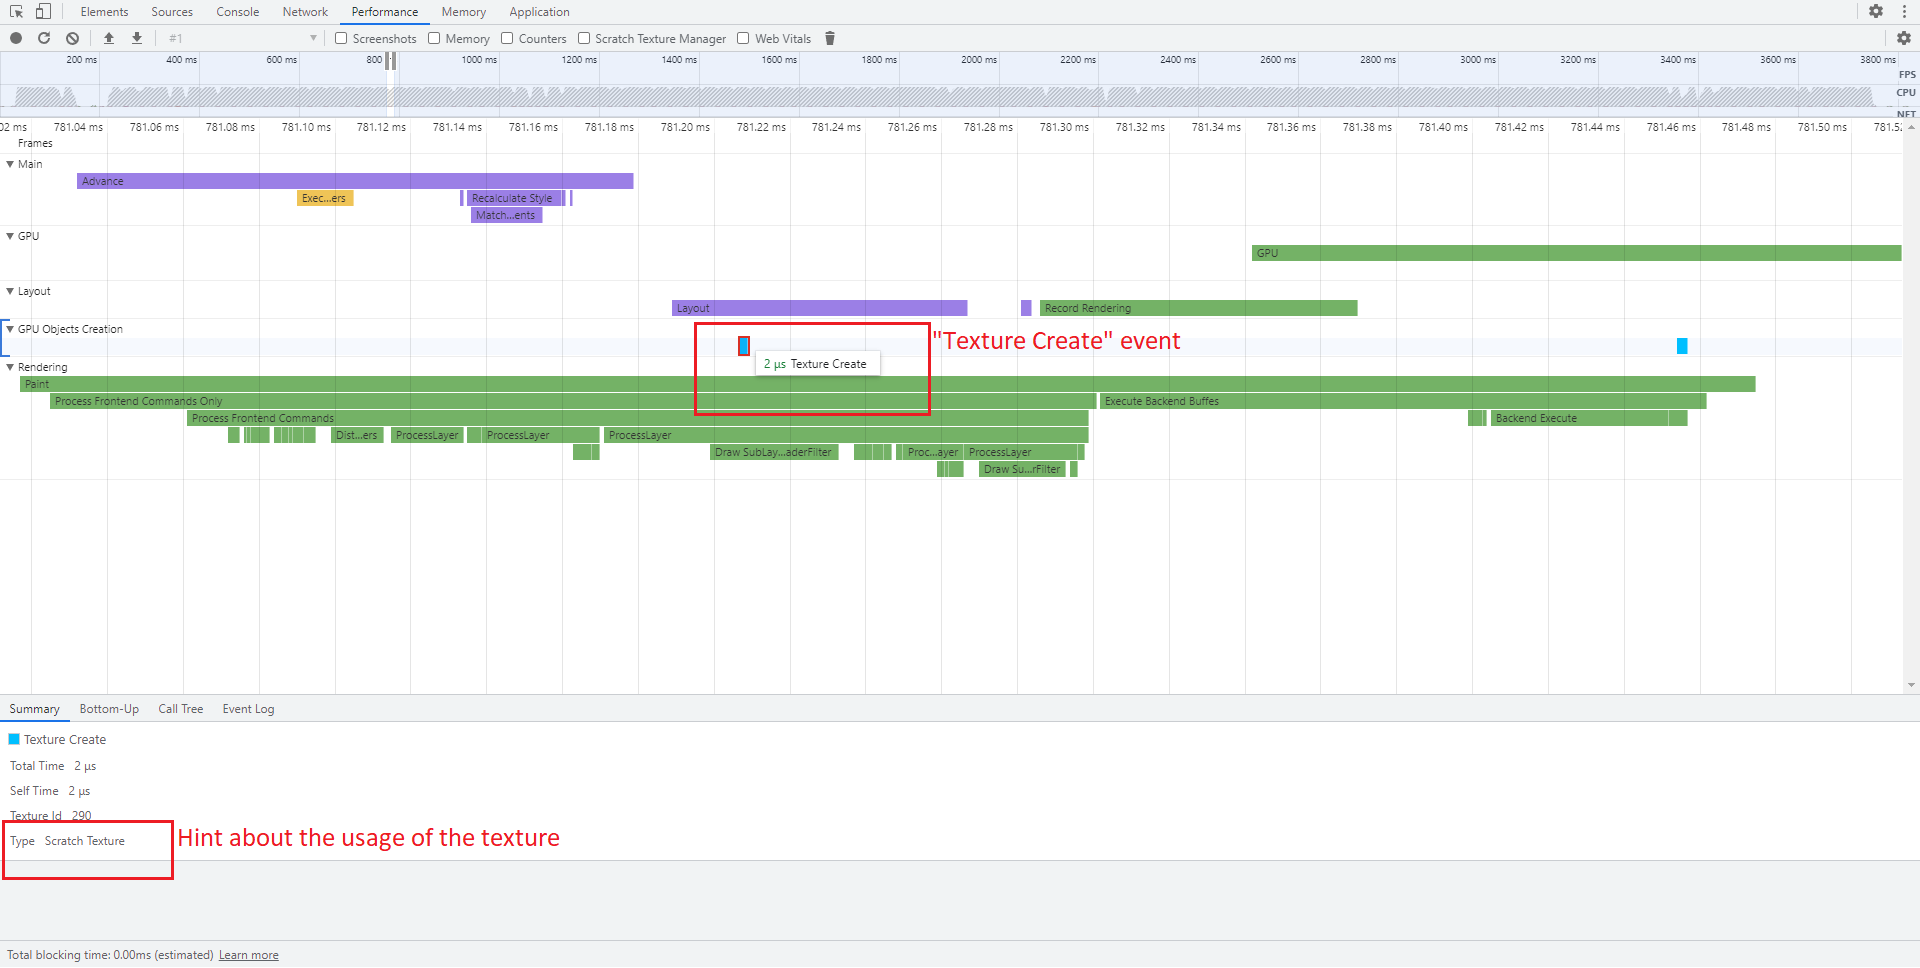
For textures, the possible types are:
ScratchTexture- temporary textures needed mostly for storing intermediate results when blurring elementsLayerTexture- textures in which Renoir draws the layers of DOM nodes.ImageTexture- textures that store images used in the HTML/CSSSurfaceTexture- textures created by Cohtml for drawing some auxiliary things like some SVGs or shadow shapes for example.CompositorTexture- textures created by Renoir to draw elements withcoh-composition-idGlyphAtlas- textures that store the character glyphs used for text renderingGradientCacheTexture- textures that store the colors needed for some gradients
For vertex/index buffers, the possible types are:
GeometryBuffer- buffers that store the geometry needed for all of the rendered basic shapesPathBuffer- buffers that store tessellated geometry of paths that are used in the HTML/CSS. Usually those buffers are due to<path>elements inside of SVGs.GlyphBuffer- buffers that store the geometry used for rendering the character glyphs. Those are created and destroyed in a single frame.
The creation/destruction markers can help you detect abnormal behavior in the object creation and destruction. In general, creating a texture for each frame and destroying it at the end can be a hint that a cache’s capacity is too small. In one of the later sections, we’ll explain how this issue can be resolved by increasing the capacity of one of the caches.
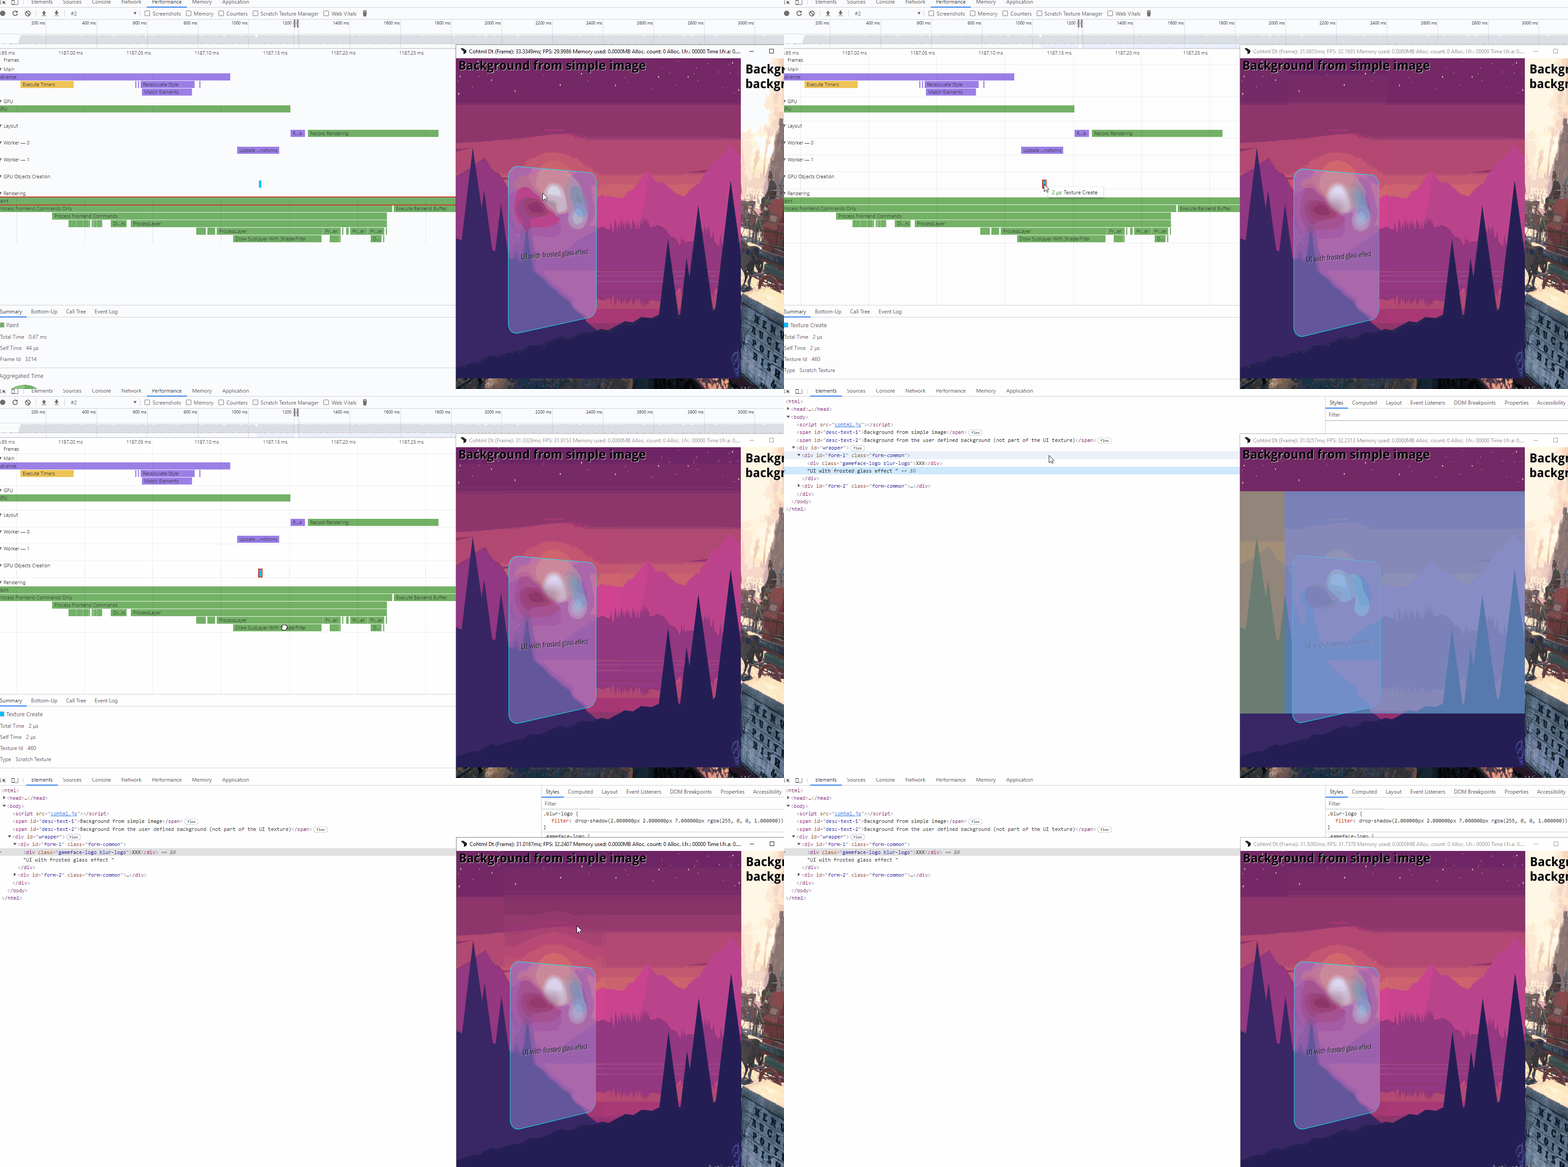
With the ability to relate DOM nodes to “Process Layer” markers, you can even deduce which node has caused the creation of a given texture. For example, notice during which “Process Layer” event has a “Texture Create” marker for a ScratchTexture that occurred. Then see to which node this “Process Layer” marker belongs. This way, we can see which DOM nodes cause potential thrashing of the texture caches in Renoir.
Textures counters
The textures counters are another feature in the Performance tab of the devtools, closely related to the trace markers for object creation and destruction.
The counters can be activated by enabling the “Counters” checkbox. This will show a separate panel near the bottom of the screen. The panel contains several charts displaying the counts of different texture types and how these counts evolve over time. The texture counts of only some texture types are tracked.
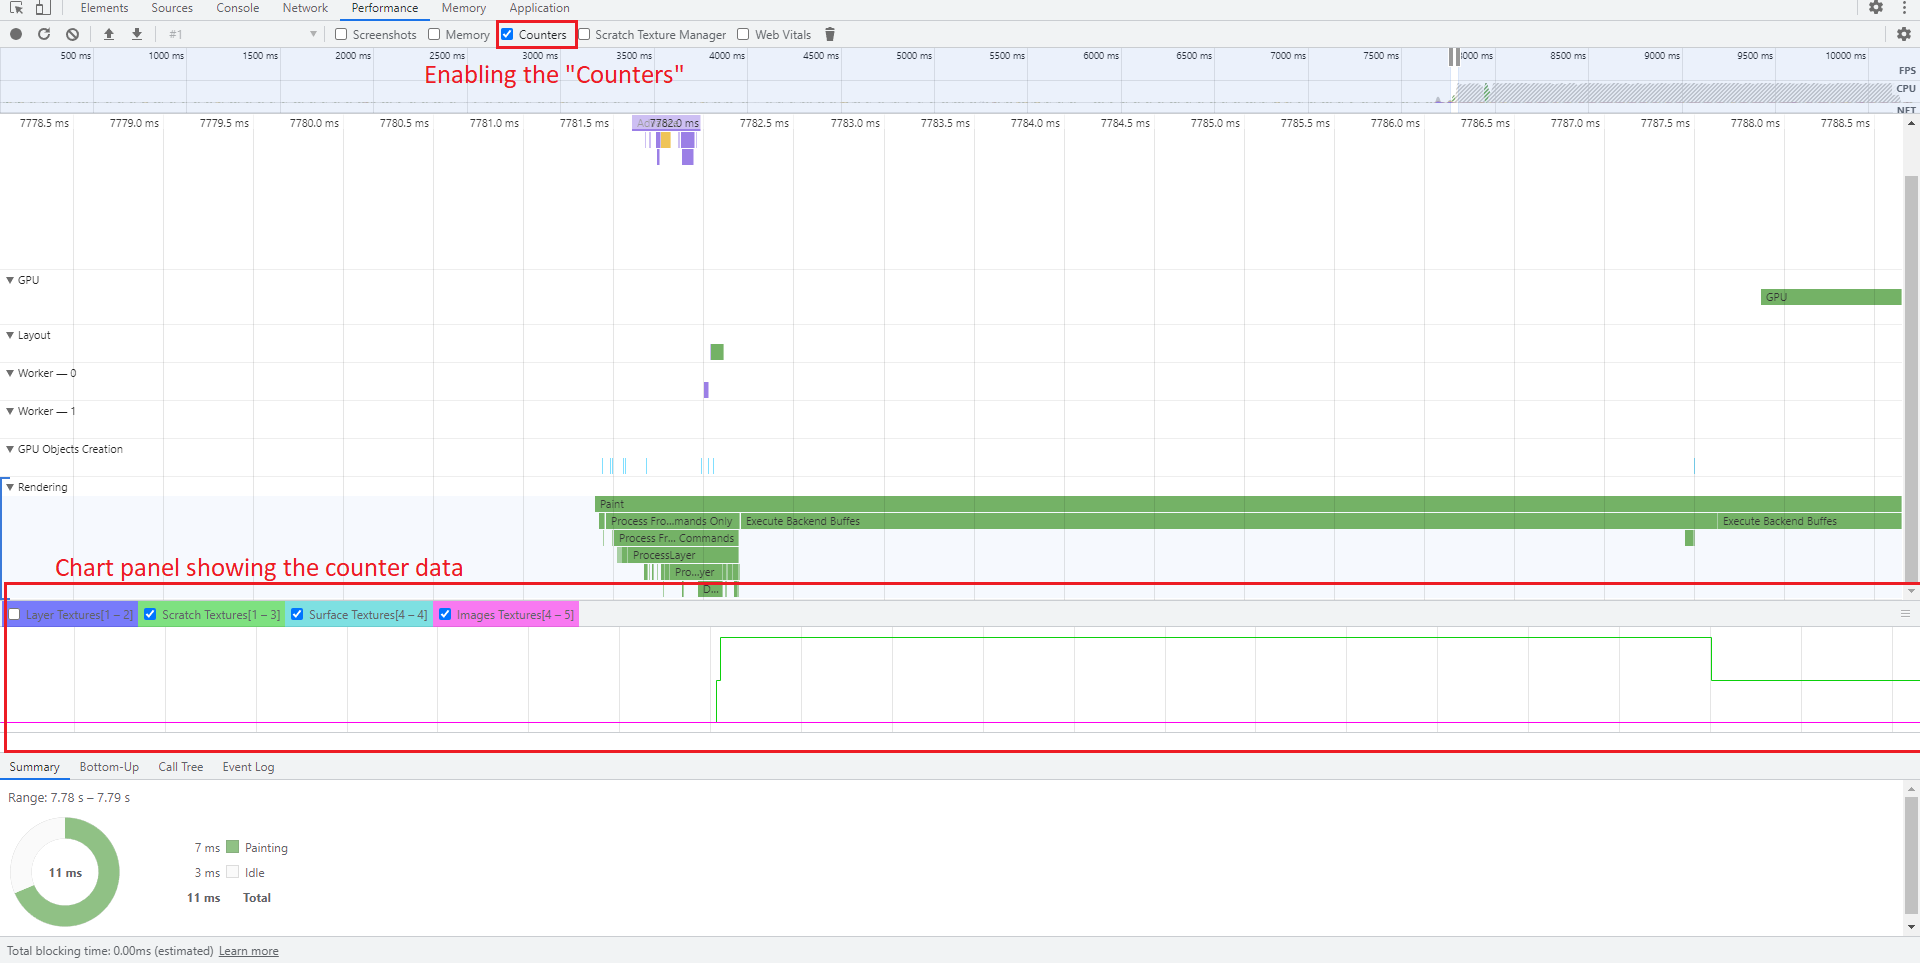
These counters present yet another opportunity to detect problems with a page. A large and unexpected amount of image textures might indicate that some of the images on a page are not released for some reason. On the other hand, excessive creation and destruction of scratch textures will present itself with constantly changing scratch textures count. For example, we might have 3 textures during rendering but then 2 between frames. This means that we need 3 textures during the frame rendering but in the end, Renoir has decided that this exceeds the cache capacity and therefore has to destroy of the textures.
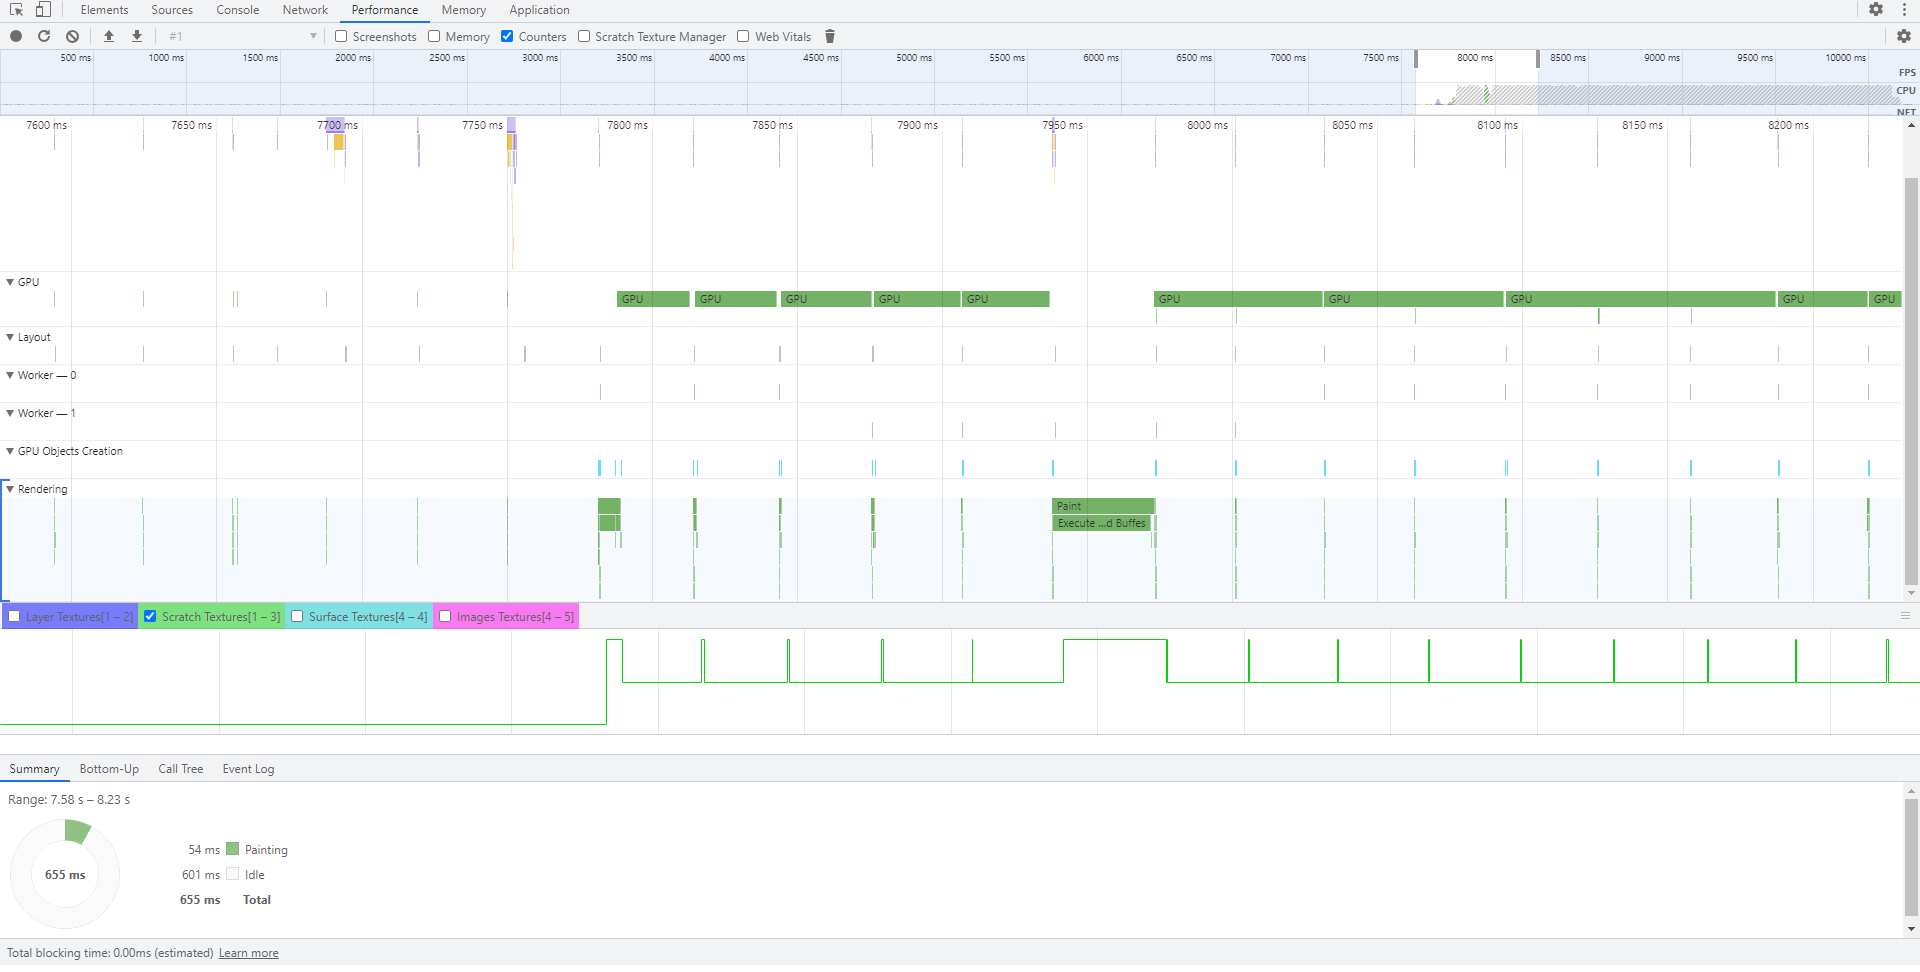
Memory counters
The other type of counters are the CPU and GPU memory ones. They give us the ability to get a better picture of the memory resources used by Renoir. These counters can be seen by enabling the “Memory” checkbox.
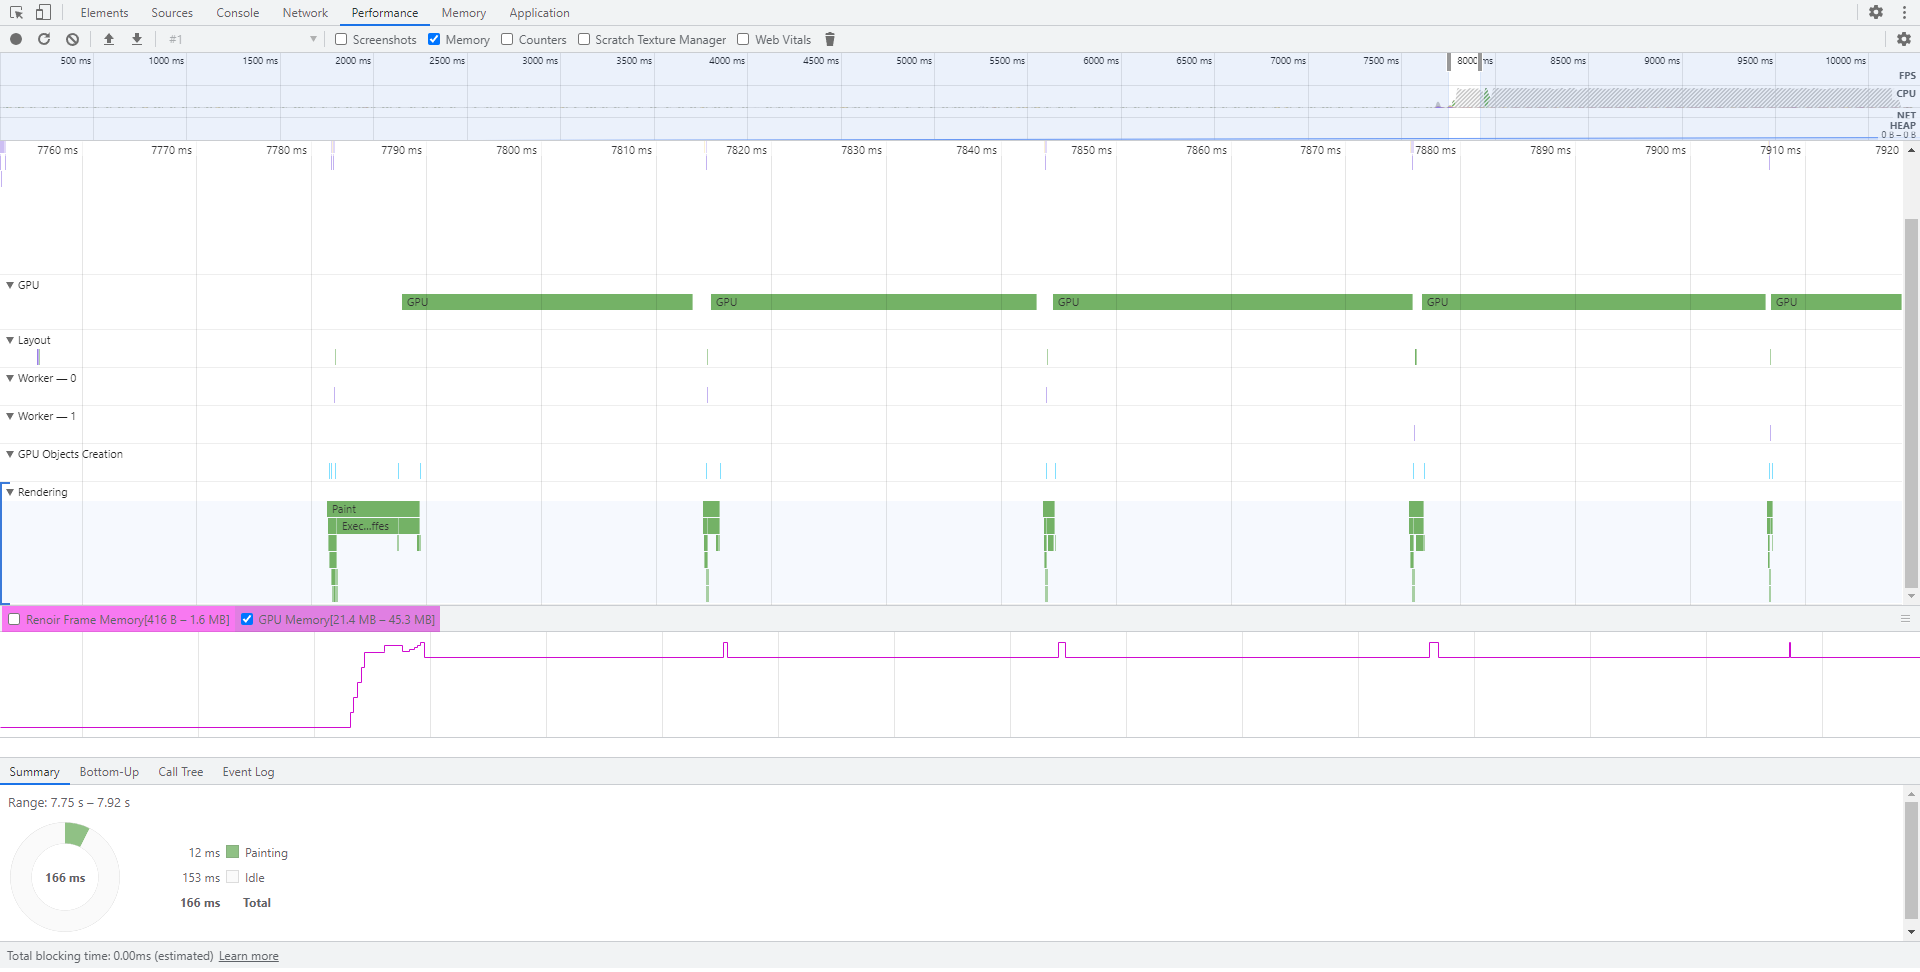
Currently, we track two types of memory usage:
Frame memory- every frame Renoir allocates transient resources with a lifetime of a single frame in the so-called “frame memory”. This memory is wiped after each frame and for the next one, Renoir starts allocating linearly from the start of the chunk. The counter lets you judge just how much memory Renoir needs for each frame.GPU memory- this is the total amount of estimated GPU memory that Renoir uses for the allocated GPU objects.
Both memory types can vary drastically based on the complexity of the UI implemented on the page. Having the memory usage exposed allows you to quantify this complexity and judge what resources you might need to render your UI.
The GPU memory usage can also be used to spot problems as discussed before. Large spikes in the memory that are there only for a short period of time might indicate that there is some constant GPU resource recreation.
Precise Scratch Texture Manager monitoring
This section is a little bit more advanced but it can help you want to fully take advantage of Prysm’s capabilities.
As previously said, Renoir allocates two types of temporary textures - layer textures and scratch textures. The allocation behavior of these is controlled by the so-called “Scratch Texture Manager”. This is an internal system of Renoir that decides when to allocate a new temporary texture and when to reuse an already created one. We can think about this manager as a cache with a set capacity that prevents constant recreation of textures that might be needed only for a single frame. When the memory for the temporary textures exceeds a certain limit, the scratch texture manager will deallocate some of the resources. There are different limits by default for the two types of textures:
- for layer textures the limit is 16 Megabytes
- for scratch textures the limit is 8 Megabytes
These limits can be changed through the View::QueueSetCacheBytesSize(InternalCaches cache, unsigned capacity) API by passing ICACHE_ScratchLayers or ICACHE_ScratchTextures as the cache argument. Setting up a appropriate cache capacity for your use case is crucial to avoid constant texture recreation.
In the performance tab, we now have the ability to monitor the state of the scratch texture manager, the currently used memory by it, as well as just how full the manager’s caches are. The “Scratch Texture Manager” checkbox allows you to inspect the relevant state of the caches and see how the memory usage evolves.
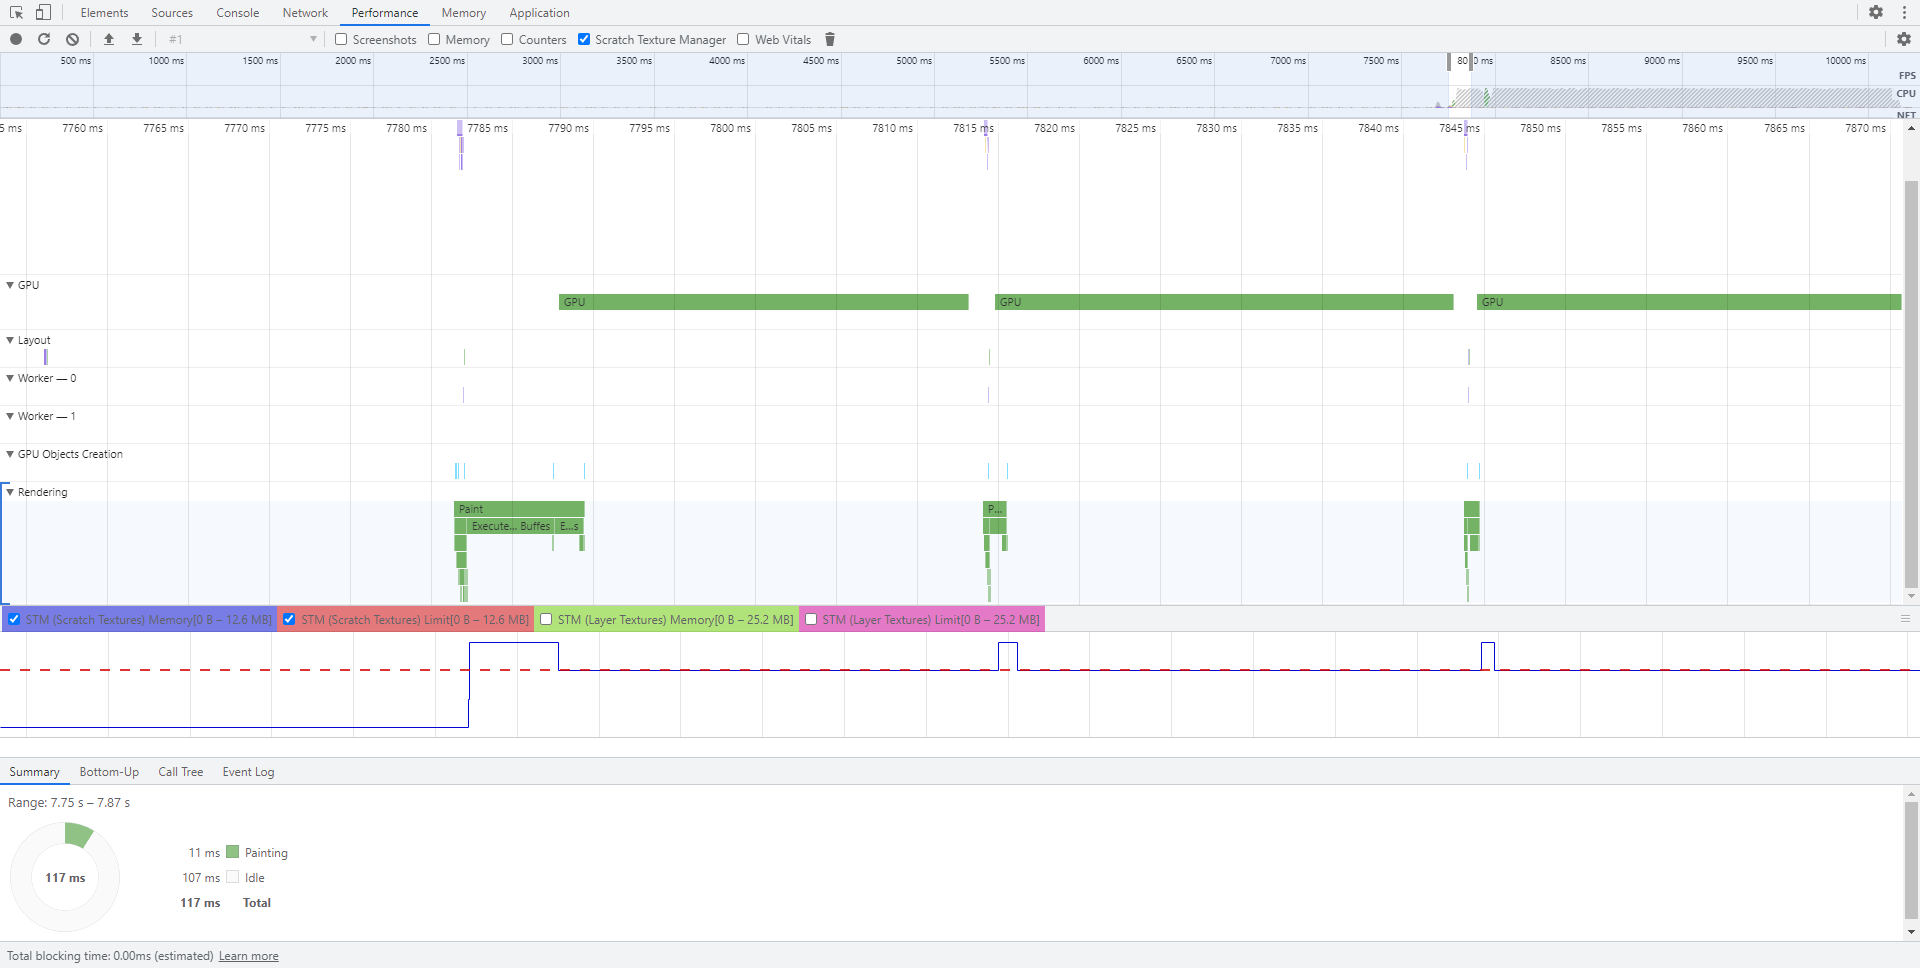
In the charts panel for the scratch texture manager, there are 4 charts that give you information:
“STM (Scratch textures) Memory” - the current memory used for scratch textures.
“STM (Scratch textures) Limit” - the cache capacity limit for scratch textures
“STM (Layer textures) Memory” - the current memory used for layer textures
“STM (Layer textures) Limit” - the cache capacity limit for layer textures
It is advisable to inspect only the charts for a single type of texture at a time as otherwise the charts panel becomes overwhelmed. The charts displayed can be controlled with the checkboxes above the panel.
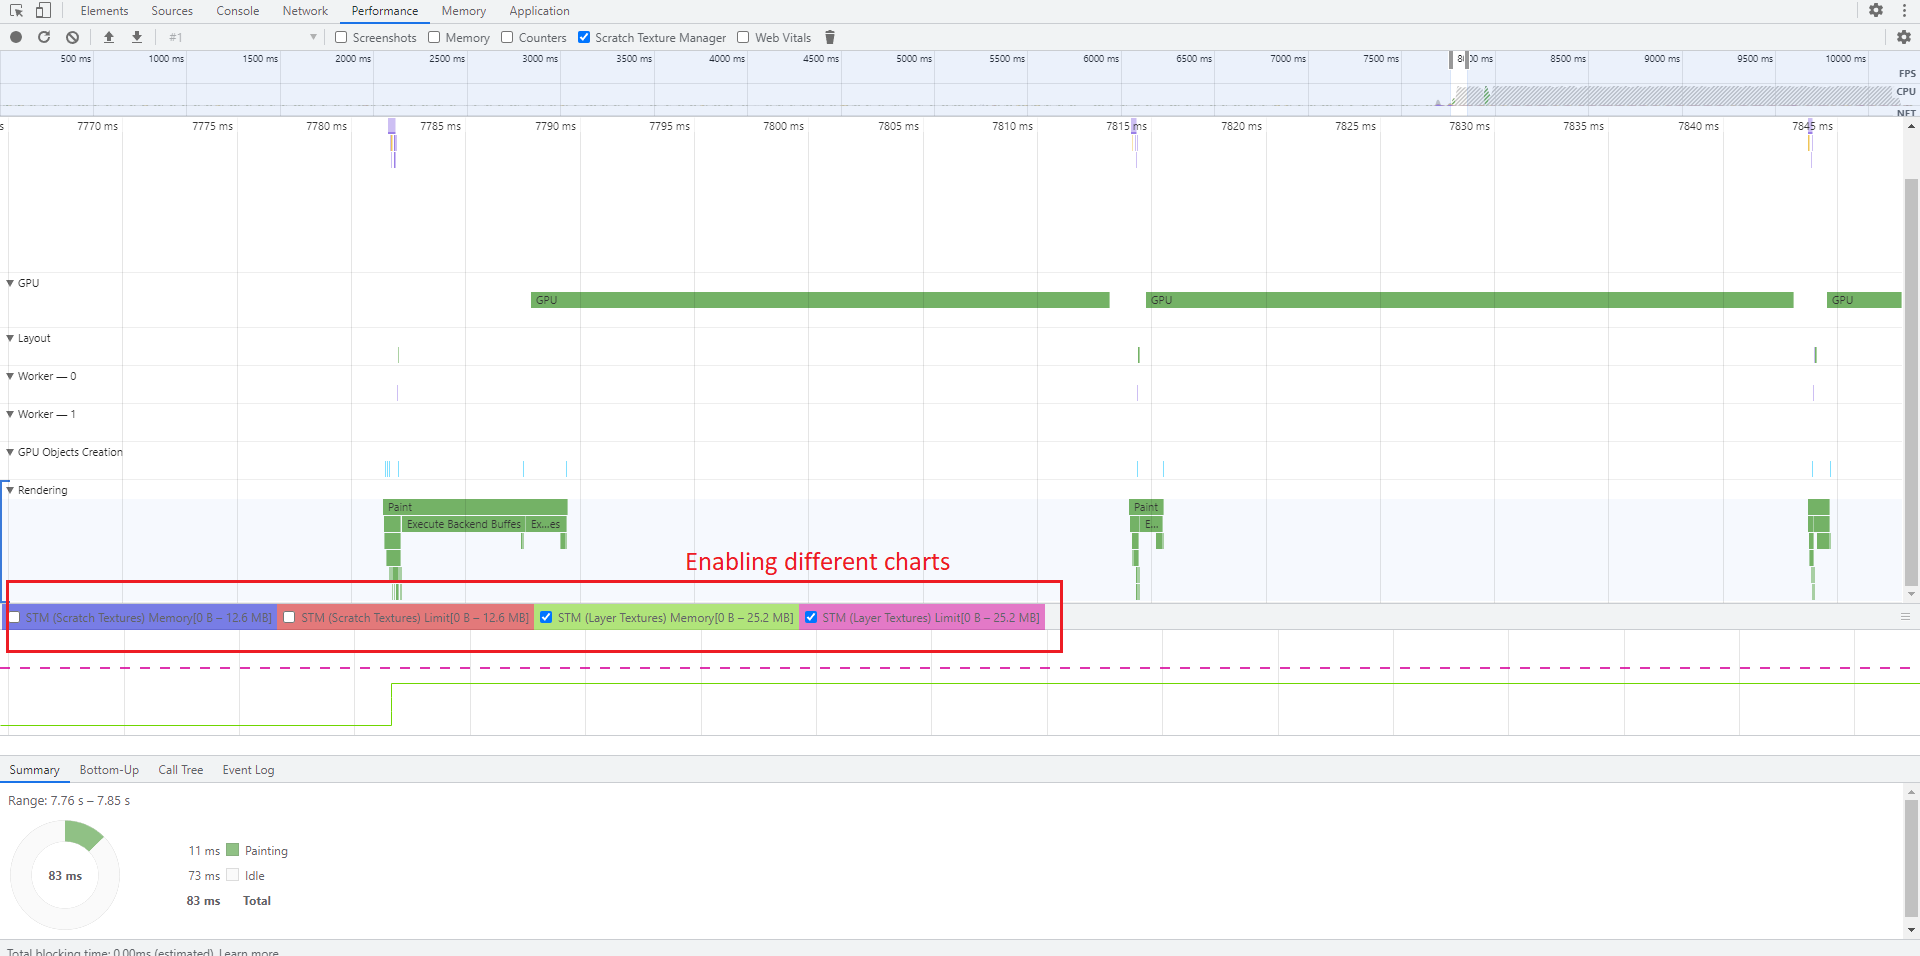
The dashed lines show the caches' limit while the solid ones indicate the current memory used. When the current memory goes over the limit, the scratch texture mange will destroy some of the textures at the end of the frame. Depending on your use case, you may have to adjust the caches' capacities to avoid their thrashing. This panel in the Performance tab will help you decide on the exact size of the caches.
Screenshots
The last feature that we’ll touch upon in the “Screenshots” checkbox. The screenshots recording works the same way it does in Chrome. Enable the checkbox and do a performance recording. Cohtml will encode a screenshot of each frame and send the data to the inspector. Then, when examining the recorded data, you’ll be able to see how the UI texture changes each frame.
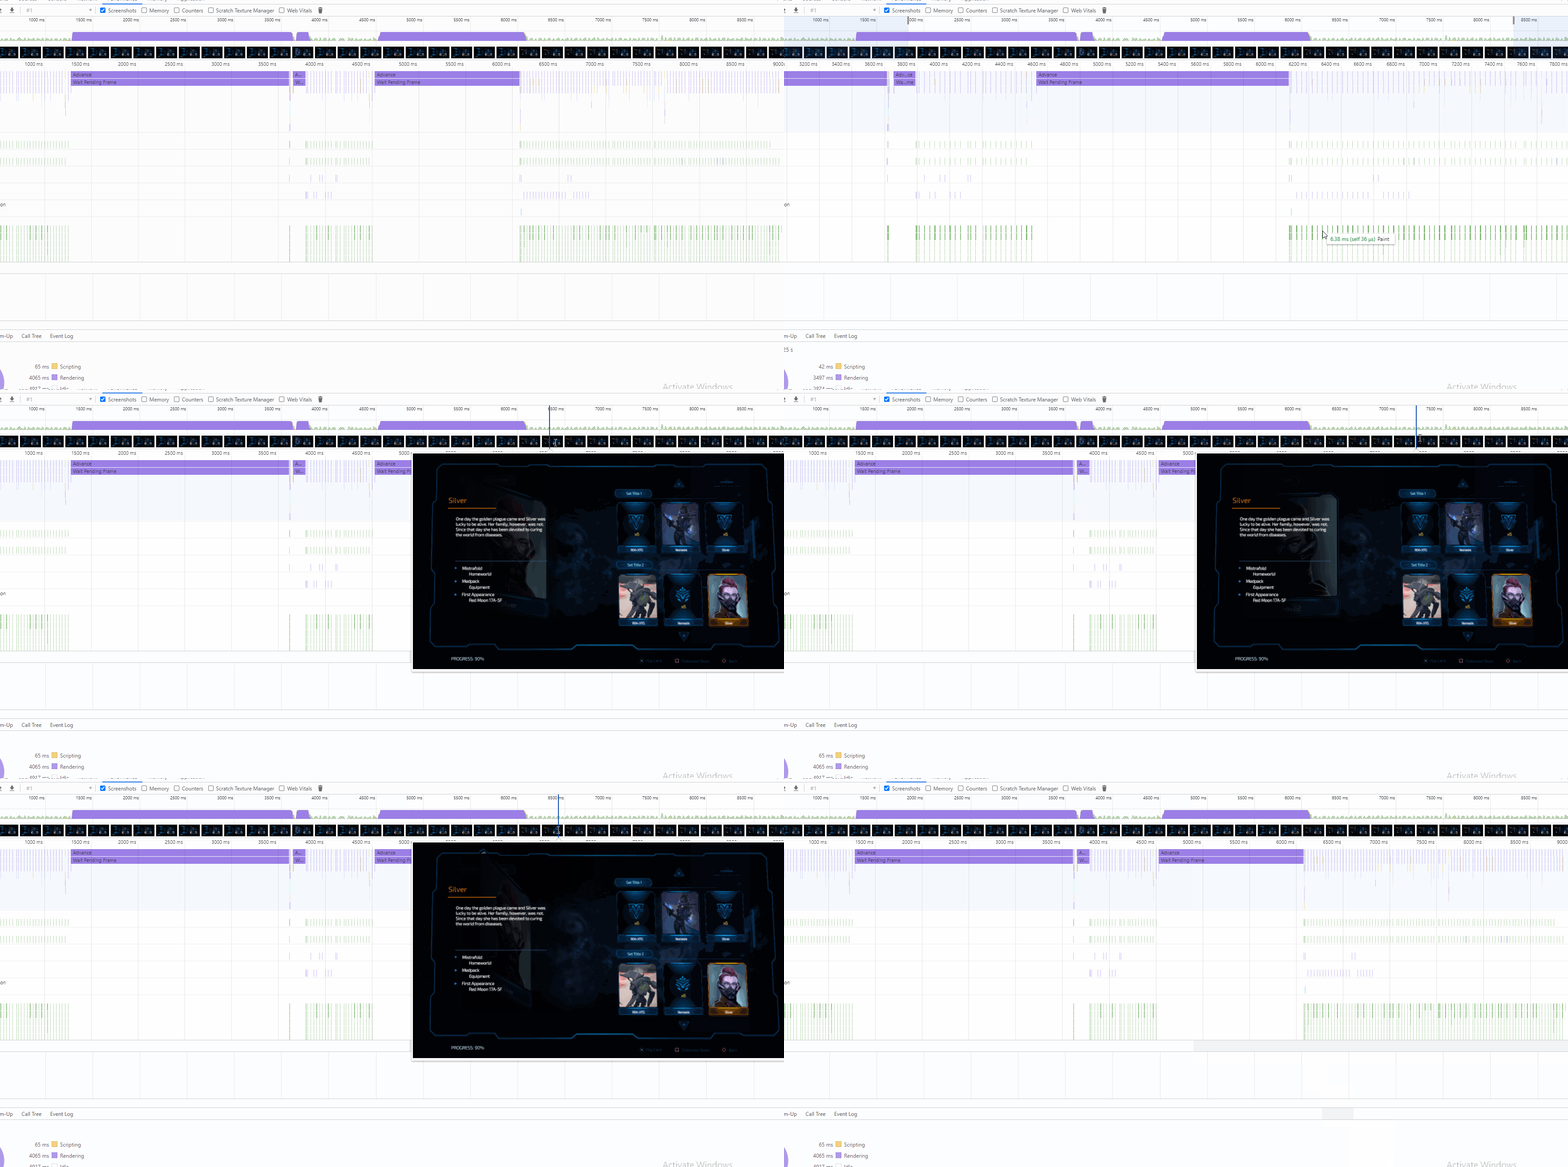
The screenshot capturing is useful when you want to some visual problem that happens in specific circumstances. You can, for example, set up a page that reproduces the issue and then runs the page while performing a recording with screenshot capturing enabled. This, the rendered page for each frame will also be saved in the resulting JSON file for the profiling session. This way it might be easier to communicate with Prysm’s support team about specific issues in a page.
Cohtml panel
Prysm has its own dedicated panel in the Inspector DevTool. The panel gives access to functionalities specific to the Prysm’s Cohtml library.
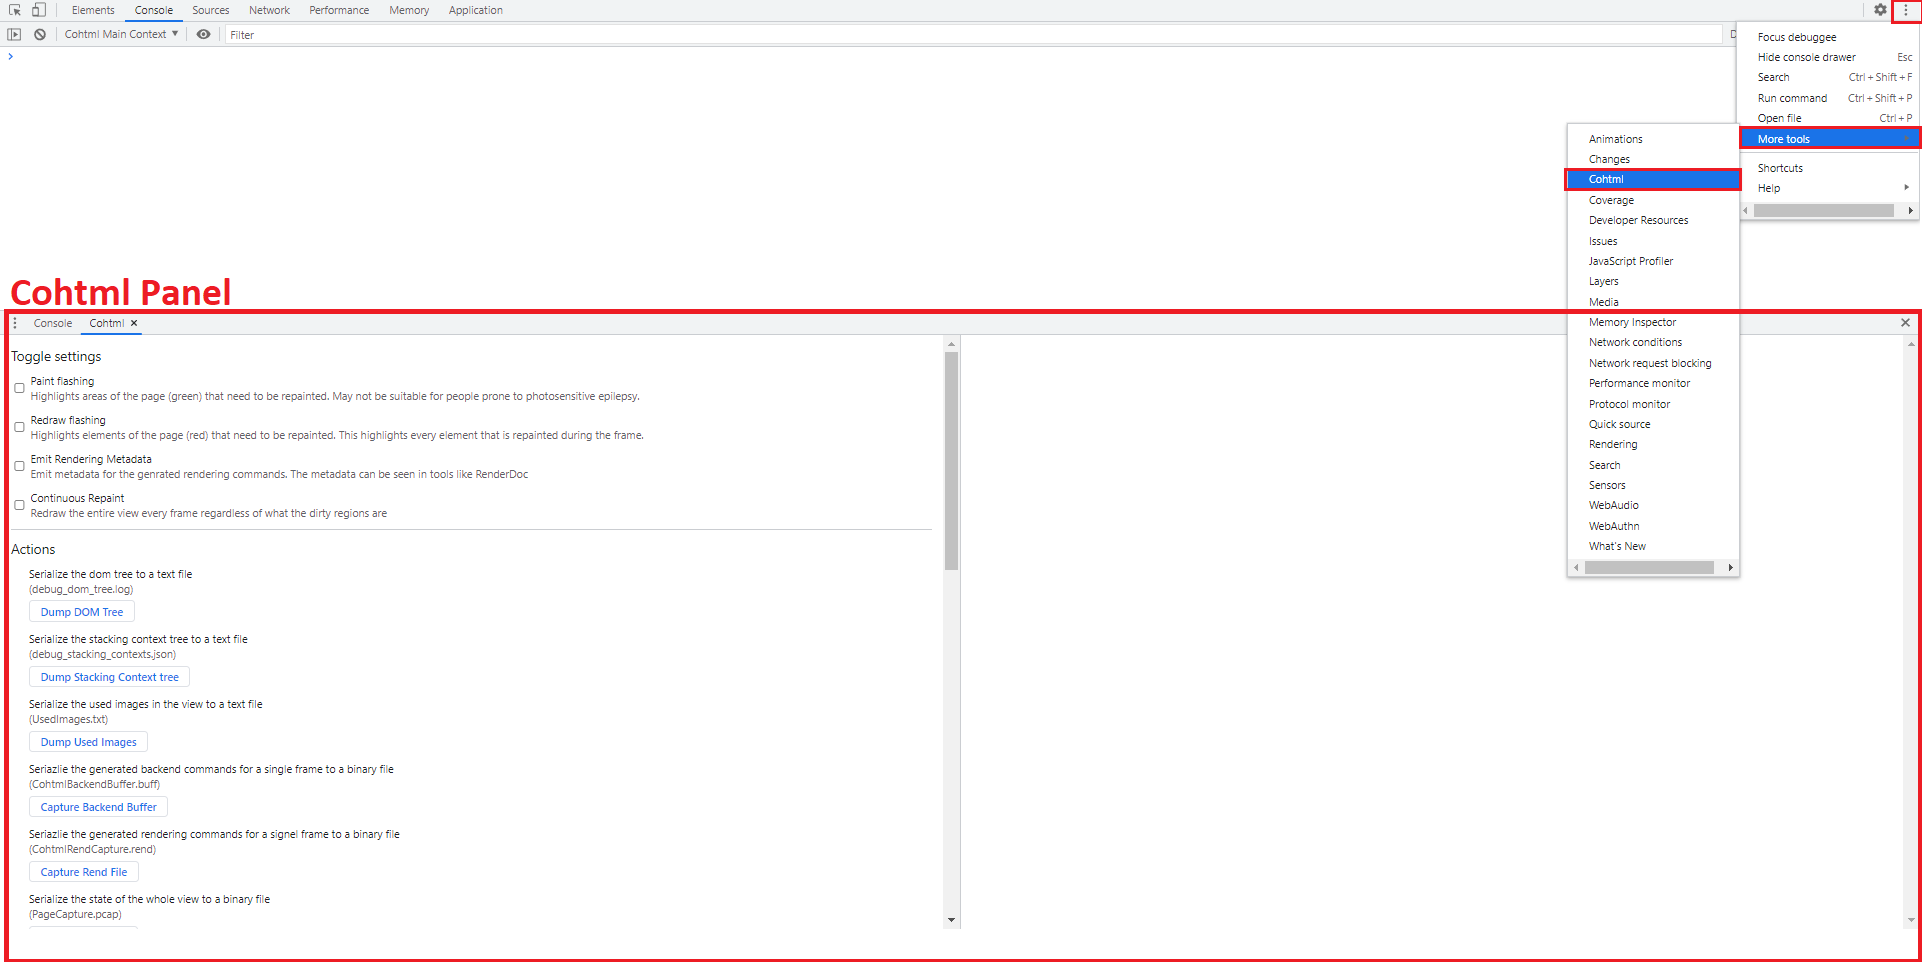
The Cohtml panel can be opened with Customize and control DevTools->More Tools->Cohtml. This will open a new panel next to the console on the lower half of the inspector.
In the panel, there are several sections controlling different behavior of the corresponding cohtml::View. Most of the provided functionality can be replicated through the C++ API but the Cohtml panel makes it more convenient to experiment.
Toggles
The first section has several toggle settings. Those are:
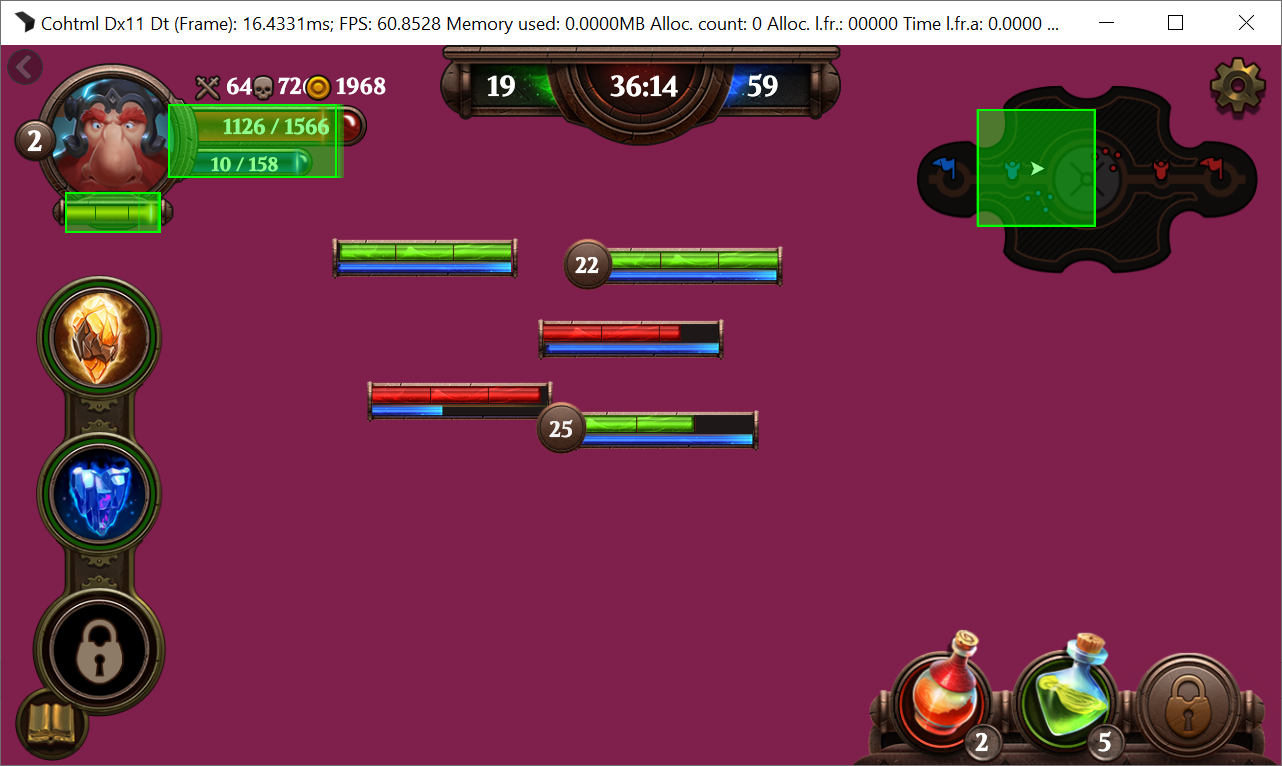
- Paint Flashing – If enabled, Cohtml will flash green rectangles over the dirty regions for every frame. Those are the regions where something has changed and where the view has to be repainted.
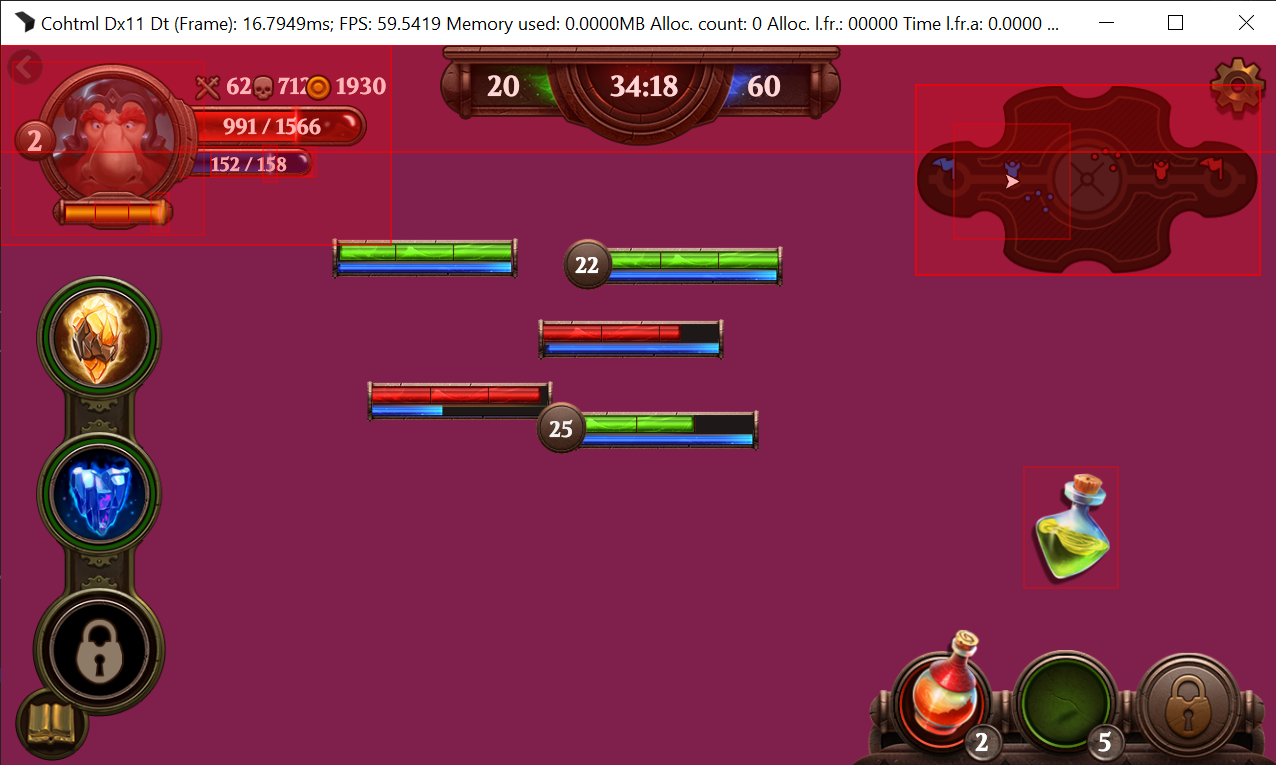
- Redraw Flashing – If enabled, Cohtml will flash red rectangles over the elements that are being redrawn. These are the element that are touched by dirty regions and have to be repainted. Cohtml will be generating rendering commands for those elements.
- Emit Rendering Metadata – If enabled, Cohtml and its rendering library will emit GPU debug markers so that every rendering command can be associated with a DOM element (given through class and id). These markers are visible in tools like RenderDoc and Nvidia Nsight.
- Continuous Repaint – If enabled, the whole view will be repainted in every frame. This is a convenient way of enabling repainting through
cohtml::View::ContinuousRepaint(bool)
Actions
The next section gives several “Actions” that can be performed on the Cohtml View. Those are direct equivalents of the cohmlt::View C++ API. Generally, the actions serialize some aspect of the view and dump the serialized data to a file. The generated files will be in the working directory of the running application. The actions should be self-explanatory and if not, there is a hint about each of them near the corresponding button.

cohtml::IFileSystemWriter interface and passed a valid object to cohtml::SystemSettings::FileSystemWriter when initializing the cohtml::System. All of the file write operations will go through this user-provided object.Cache control
The “Cache control” section gives you basic control over the image cache of Cohtml. The Clear Cached Unused Images does exactly what it says while Get System Cache Stats can give you a list of all images currently loaded in the system. Upon clicking the button, a list of image names and their size in bytes will be visualized in the right part of the panel.

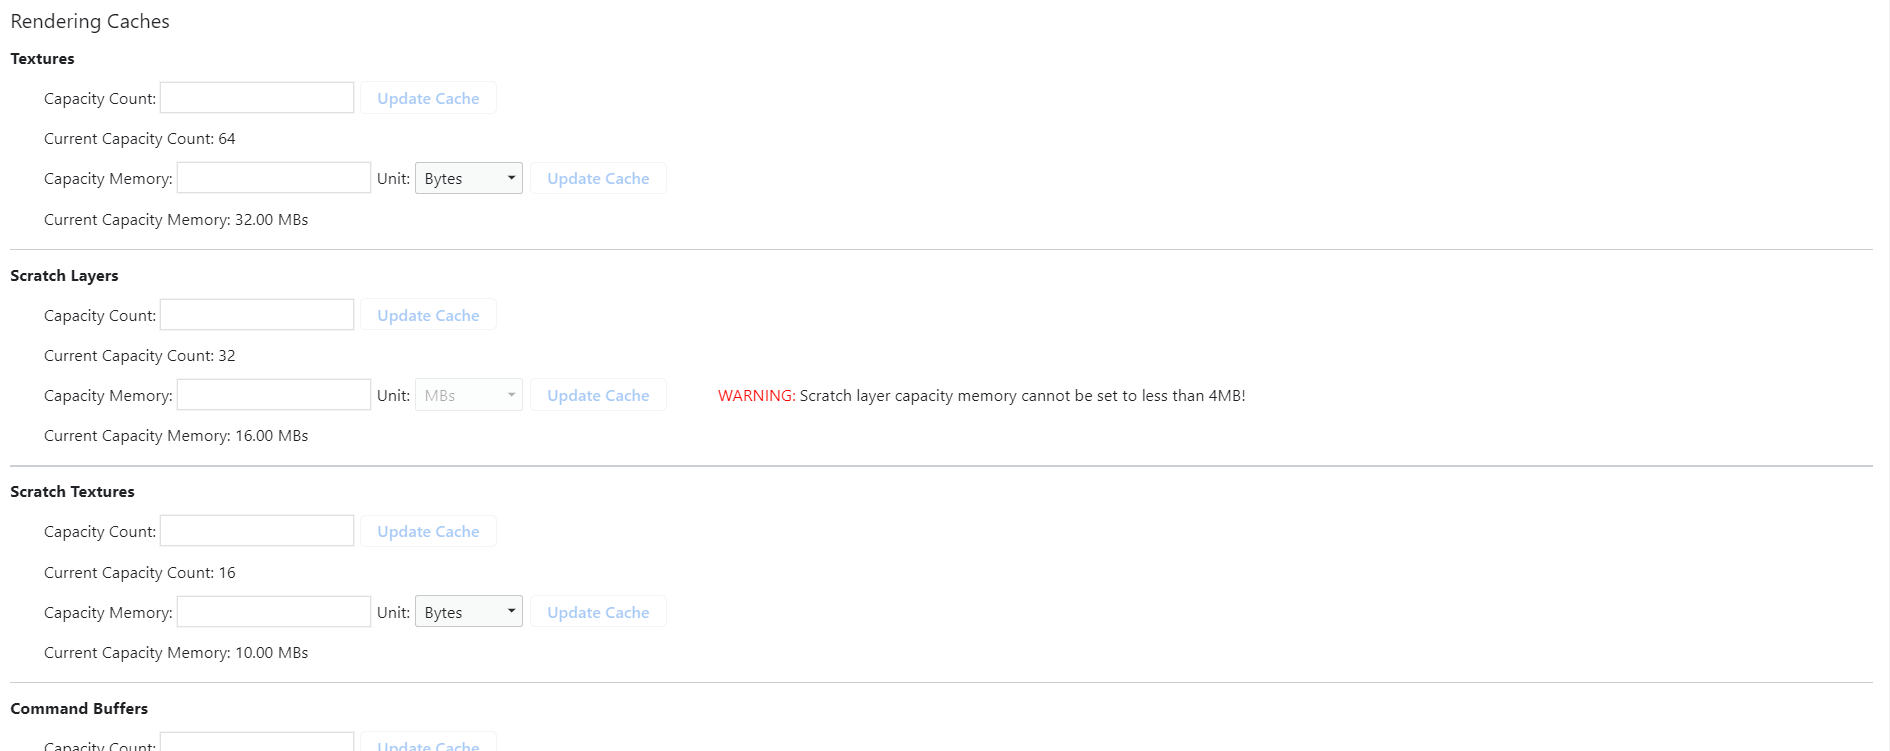
Rendering Caches
This section gives the user an easy way of interacting with the cohtml::View::QueueSetCacheCountSize and cohtml::View::QueueSetCacheBytesSize methods of the Cohtml View. As the name suggests, the focus is on the rendering caches for different types of textures as well as some other structures used during rendering – Command buffers and Command Processors. For each cache, we can set the maximum count and maximum memory in bytes/KBs/MBs that the cache should occupy.
