Enhanced Performance Tracing
If you are not familiar with Prysm’s performance capture capabilities, you can see our other guide on the integration with the Chrome’s inspector
Selective Tracing
Prysm has the ability to enable advanced performance markers during performance capture through Chrome’s inspector frontend. Before a recording is started we can select a System which is to be traced as well as a Trace Level. The point of this is to allow more targeted performance analysis of Prysm whilst not overwhelming the inspector frontend with trace messages. Generating lots of trace markers has a toll on the performance of the running application so we want to have an opportunity to limit their count and still have the ability to gain insight into the run-time behavior of the Cohtml::View. The trace markers filtering allows us exactly this.
Trace Level – the trace level allows developers to select from three levels – L1, L2, and L3 – depending on the details needed for a particular performance capture. L1 gives us only basic high-level markers which give us the most accurate performance numbers for the processing stages of a view. L3 on the other hand generates lots of trace markers which give the most information on what is actually happening in the system. As Cohtml has to generate all of those markers, the overall performance might be slightly degraded. L2 gives us a middle-of-the-road experience in terms of details.
Trace System – there are a lot of stages of the processing of a given page. Limiting ourselves to a single stage or subsystem allows us to better focus on one problem at a time. Also, we can again avoid taking the performance hit of lots of trace events. The Cohtml systems that can be selectively traced are:
- Advance – the things that happen during
cohtml::View::Advance. This happens on the UI thread - Layout – what happens when the layout engine does its work. This happens in a worker thread when there is a dedicated layout thread.
- Displaying – the recording of the painting commands for every element in the DOM. This happens shortly after the layout
- Painting – the things that happen during
cohtml::ViewRenderer::Paintand it happens on the rendering thread. - RenoirFrontend – the first phase of the Cohtml’s rendering library. This is where the backend commands are generated for all of the high-level painting commands recorded during Displaying.
- RenoirBackend – the second phase of Cohtml’s rendering where the rendering commands are executed through the rendering backend.
- Advance – the things that happen during

In the next section, we’ll give a more in-depth overview of each subsystem and its trace markers.
Using the performance marker filters
The trace filters are in the advanced recording options in the Performance tab of the inspector. Those options can be opened with the little cog button on the toolbar.

Most of the options there are not supported by Gameface. The trace levels and systems are in the rightmost section. The trace level and system have to be chosen prior to starting a performance capture.
Tracing Markers and UI performance optimization
In this section, we’ll go over every major subsystem of Cohtml and we’ll explain what the most relevant markers mean. The focus is to give users an idea of what takes time in the processing of a page, how can something be optimized, and how UI design decisions might affect the final performance.
First, here are some general rules to follow when doing a performance analysis of a page:
Use the tracing levels and system to limit the amount of markers generated by Cohtml. As previously said, there is some overhead of generating events for all of the markers. Generally, the more markers are generated, the less accurate the timing results will be. L1 tracing is helpful in identifying the big performance sinks that you are interested in. L2 tracing gives a bit more information about why the results are the way they are. L3 gives us a very fine view of the elements processed in some of the processing steps and we can even identify DOM nodes that cause the performance hits.
Inspect the metadata attached to some of the events. Certain events carry a bit more information about the context in which they were generated. The metadata is given in the Summary panel below the timeline view.

- Be mindful of the cost of recording. Doing L3 tracing of all systems can quickly generate lots of events that amount to hundreds of megabytes of memory. On some platforms this can lead to OOM (Out-Of-Memory) crashes when running the Player application.
cohtml::View::ExecuteCommandProcessingWithLayout the RenoirFrontend marker happens on the layout thread (shortly after RecordRendering) or on the render thread (during the call to cohtml::ViewRenderer::Paint)Advance
The Advance marker encompasses the entirety of the call to cohtml::View::Advance. This would generally be the biggest performance impact of Prysm on the main thread of an application, so it is important to understand what happens in this call. A big amount of the work for the visualization of a page happens in worker threads, but the Advance contains a few important pieces that should be kept in mind. Those are:
- Execution of JavaScript – this is where almost all of the javascript should run. In a performance recording, the main marker that tracks this is Execute Timers. If there is a JS overhead of a page, expect to see this marker get large.
- Animation ticks – All of the active CSS animations are processed and advanced during the Advance call. The main marker for them is Iterate Tick Animations. Its metadata contains information about the number of animated elements. The time needed for animations is proportional to the number of animated elements as well as the number of animated properties of each element.
- Style solving – After the JS and animations have been run, some nodes might have their CSS styles changed. The CSS styles have to then be solved for those elements and the parts of the DOM tree they occupy. This can be seen in the Recalculate Styles marker which contains information about how many elements have been changed and need style resolve.
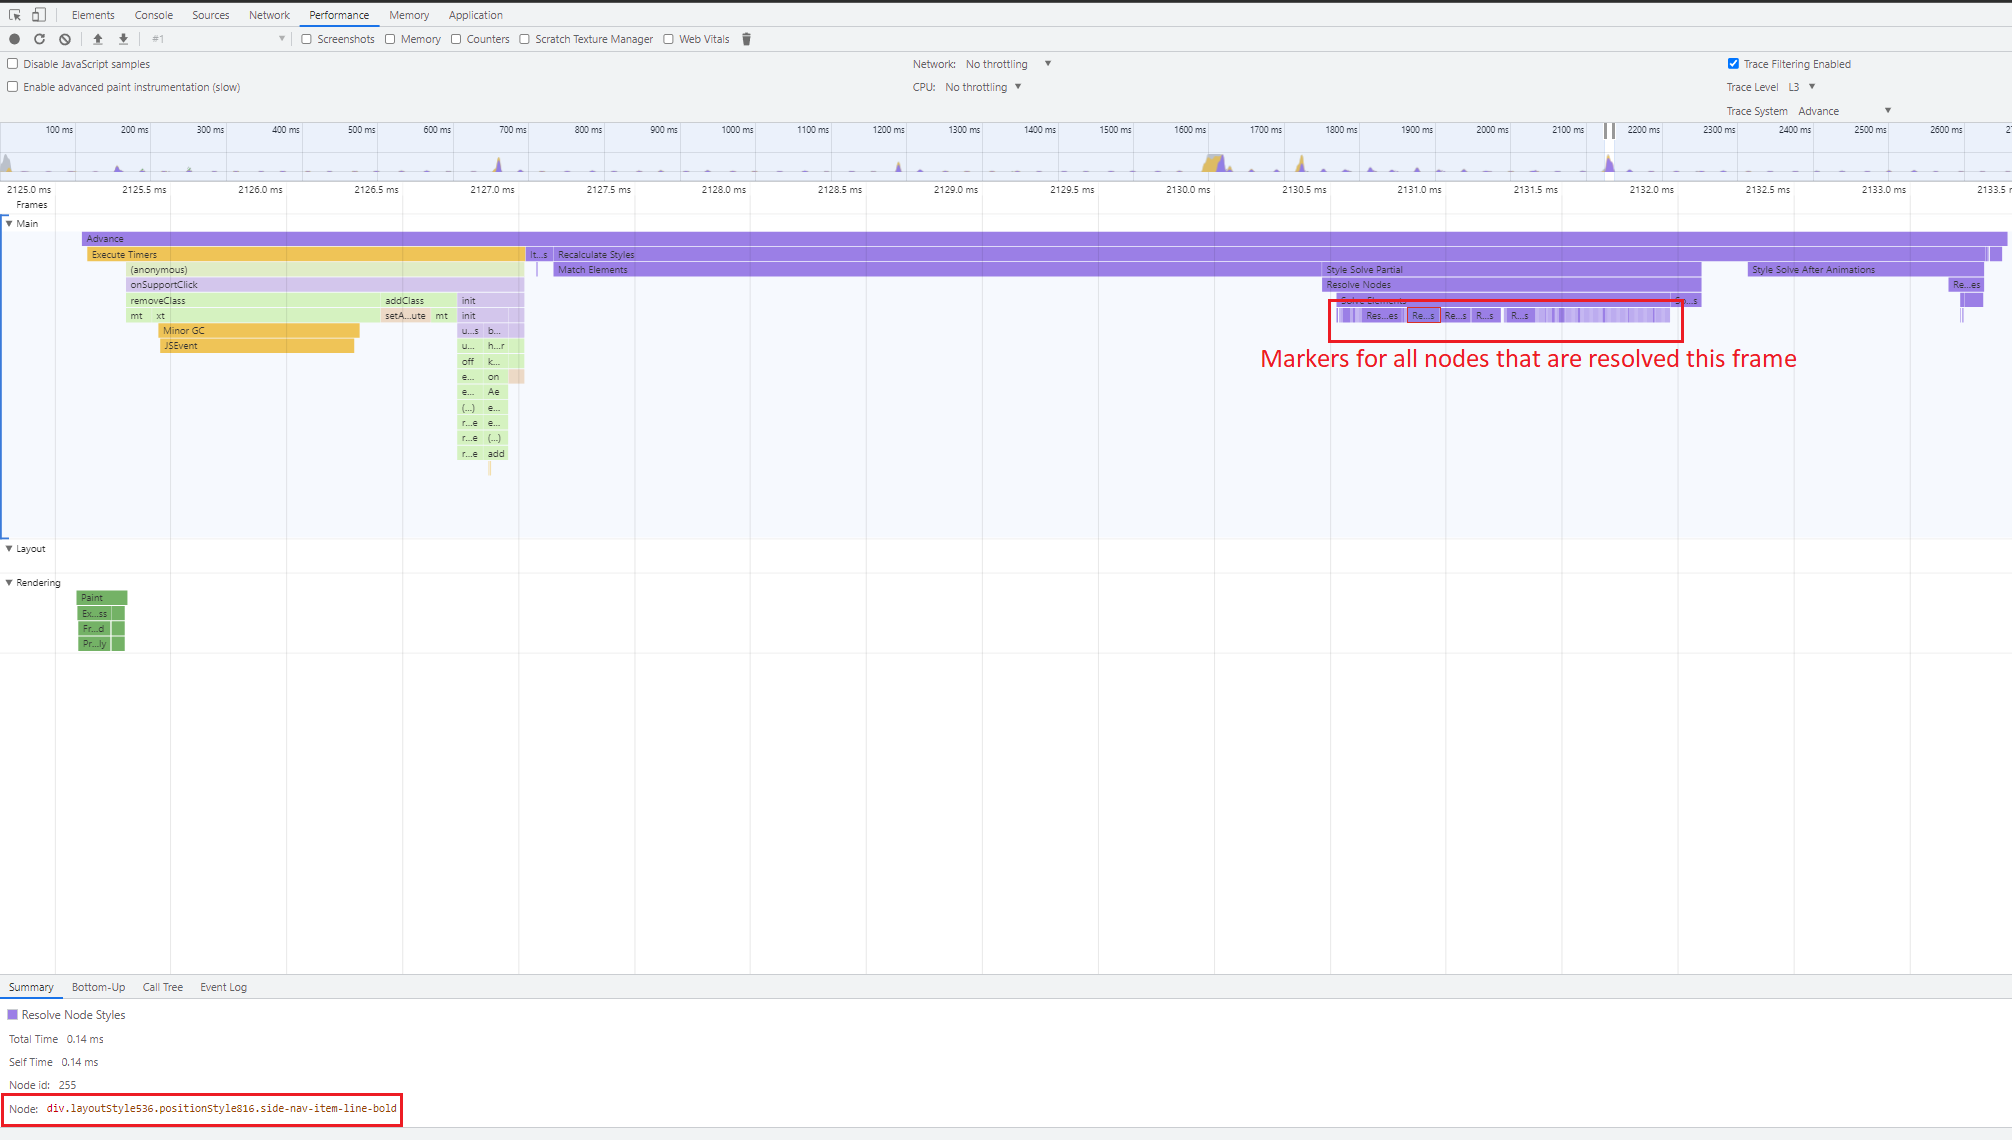
In L3 tracing of Advance there is the Resolve Node Styles marker. It shows every individual node that is resolved during style matching. It contains information about the exact DOM node and hovering the marker will highlight the node in the viewport. Also, in the summary panel below there is a node path. Clicking it will take you to that node in the “Elements” tab.

General rules to follow when optimizing for Advance
- Minimize the number of DOM nodes that change their styles – even if a single property of a DOM node is changed, it will be submitted for style resolution. We want the least amount of work during Recalculate Styles.
- Minimize the number of animated properties – they directly affect the processing of animations and the Iterate Tick Animations.
- Be mindful of JS execution – Cohtml has no control over the amount of JS that is being executed during Execute Timers. This marker shows exactly how much JavaScript is done per frame.
Layout
The layout is executed in a worker thread and can be seen with its main marker Layout. During this phase, the layout engine is invoked and for every DOM node, we decide where exactly it will end up on the screen. Depending on what properties have been changed during the style solve in the Advance this can happen in one of two ways:
- If there are changed “layout properties” we have to solve the layout of the whole DOM tree. This is a heavy operation. The marker that indicates a full layout solve is Solve Flex Layout.
- If there are no changed “layout properties”, we can issue lightweight updates for modified DOM nodes. This is much faster than a full layout solving. The marker for this lighter operation is Update Node Transforms.
We mentioned that there is the concept of “layout properties”. Those are CSS properties that affect the layout of a DOM node and possibly its siblings. Those are properties like top, botton, flex properties, padding, margin, width, height, etc. If any of these properties are changed for a node, a full layout solve for the tree is required, and those changes might affect the layout of the whole page.
A marker directly related to the Layout but that is not actually under the Layout marker is Synchronize Layout To Main. This is where the properties calculated in the layout are made visible on the UI thread and with that in the JS. Only nodes affected by the previous frame’s layout changes are synced. This means that if there are lots of layouts changed nodes for frame N, we can expect some time for synchronization in the Advance of frame N+1.
The Update Layout Nodes marker contains information about the number of nodes with changed layout.
General rules to follow when optimizing for Layout
- Minimize changes to layout styles of nodes – this will allow the lighter layout solve to be performed. If no layout changes are detected, the layout may even be completely skipped.
The flex layout algorithm
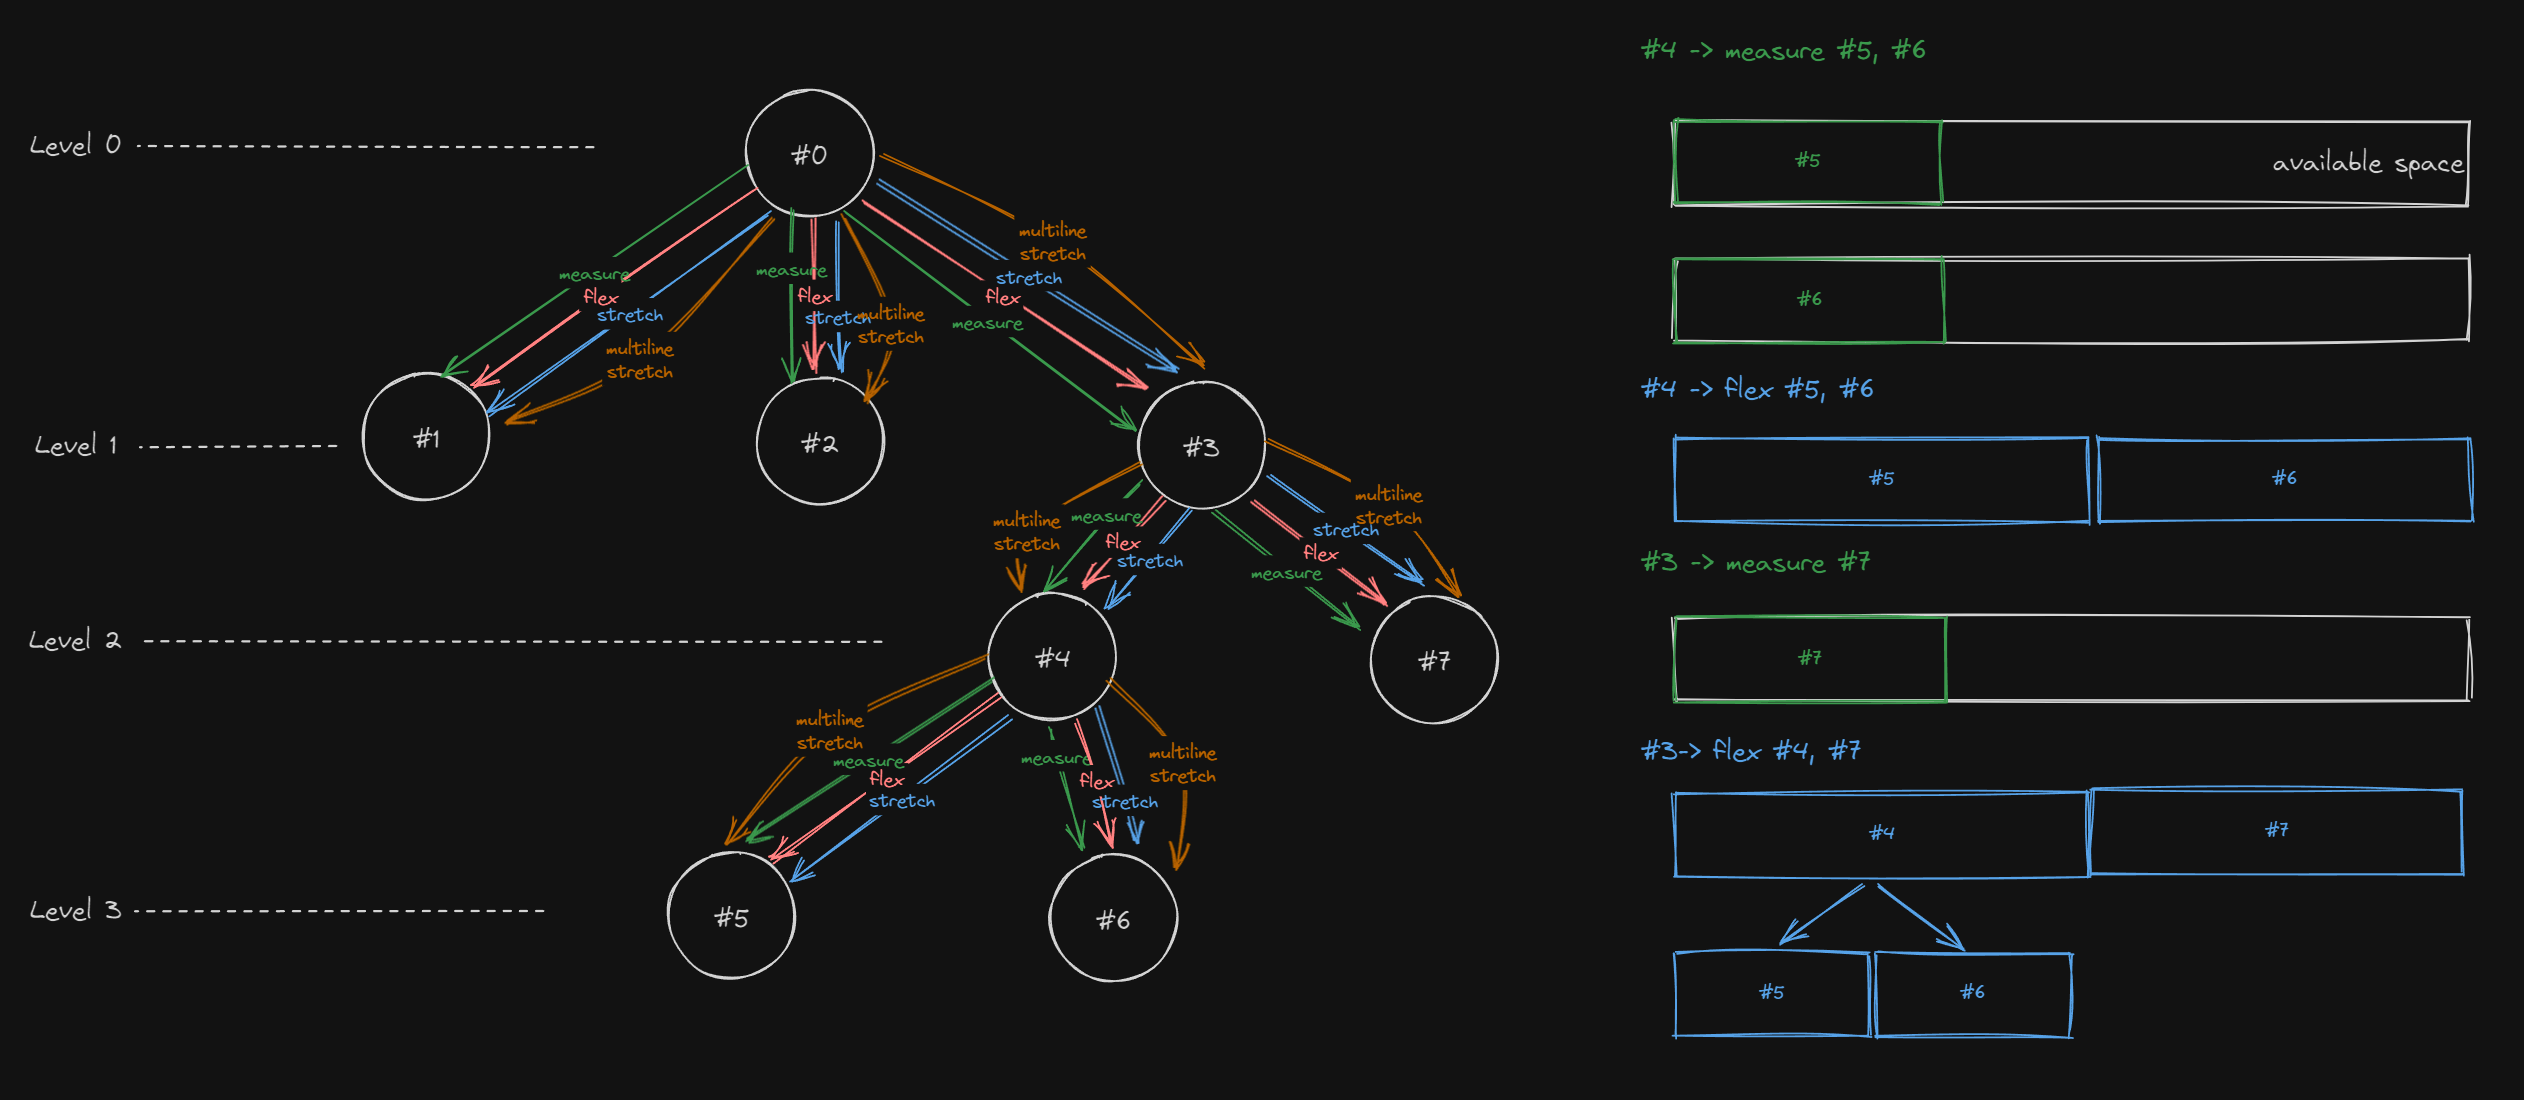
Prysm uses the flex layout algorithm for both display: flex and display: block. For each DOM node the flex layout algorithm can be summarized in the following steps:
- Measure the
flex-basisof all child nodes. - Flex the nodes to fill the available space on the main axis based on their
flex-growandflex-shrinkproperties. - Stretch the nodes on the cross axis based on
align-items: stretchandalign-self: stretch. - Calculate child positions based on
justify-contentandalign-content.
When flex-wrap: wrap is used and multiple lines are generated due to overflow, the stretch step is executed twice.
To compute the layout of the tree, Prysm recursively calls the layout algorithm for each node in the following scenarios:
- When
flex-basisAND the main axis dimension is not defined. - When a node is
flexedto fill the available space on the main axis. - When a node is
stretchedto fill the available space on the cross axis. - When multiple lines are generated and a node has to be
multiline-stretched.
Flex performance degradations
Understanding the performance implications of the flex layout is crucial, as the worst-case scenario results in an algorithmic complexity of O(4^Depth). To optimize performance, caching is employed: if a node’s layout has already been computed with a similar input, the cached result is reused instead of recalculating.
While caching significantly improves performance in most cases, certain layout configurations can degrade performance:
- A deep DOM tree
- Multiple children at each level
- Lack of explicit dimensions (
flex-basis,width: auto,height: auto)
When dimensions are undefined, available space is continuously recalculated and divided across elements at each level, leading to frequent cache misses and performance slowdowns.

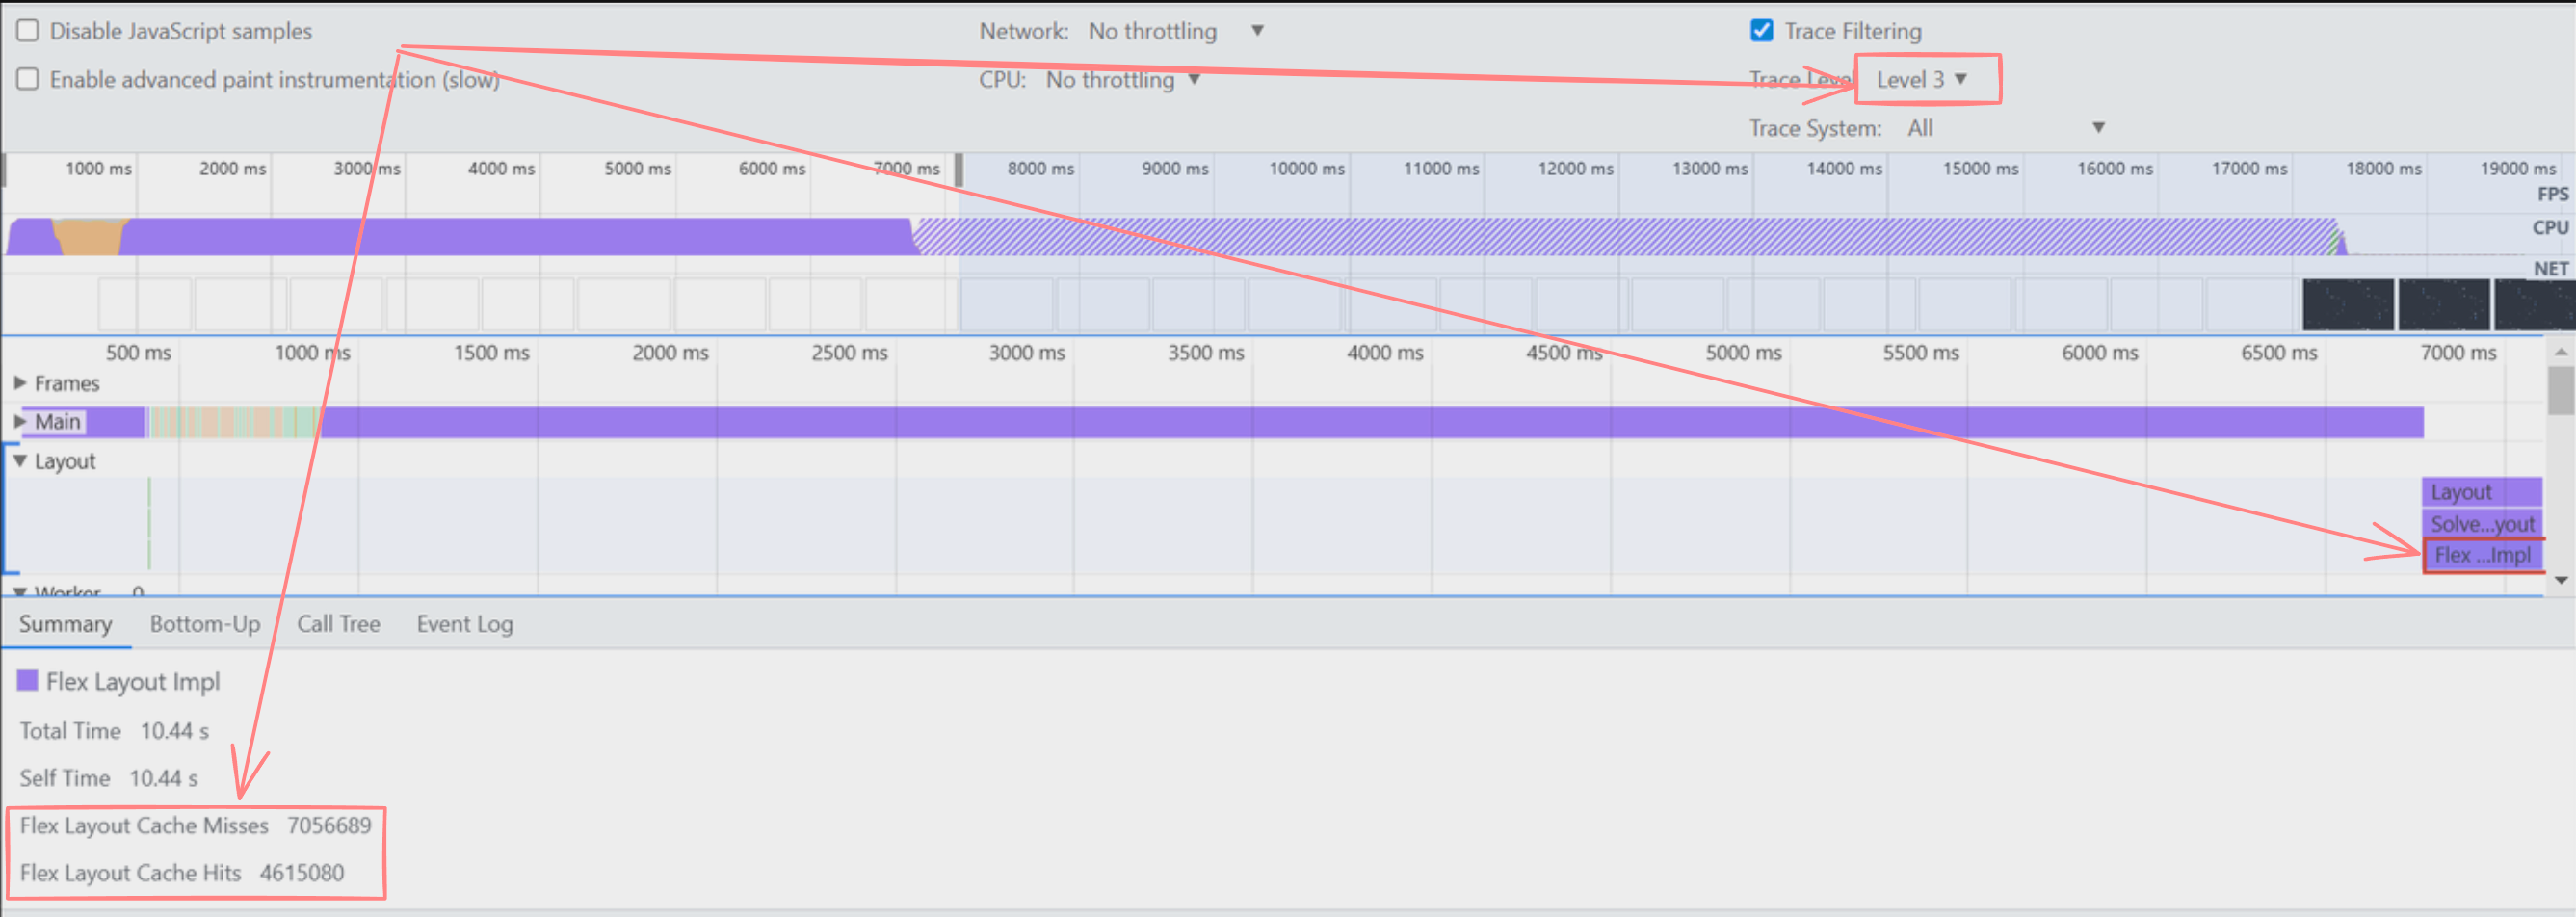
To diagnose aggressive cache invalidation, cache statistics have been added to the FlexLayoutImpl marker.

Flex performance optimizations
To improve performance, consider the following optimizations:
- Reduce DOM depth to minimize complexity.
- Define
flex-basisand main-axis dimensions (width,height) whenever possible. - Use
align-items: stretchandalign-self: stretchsparingly to avoid unnecessary recalculations. - Leverage
position: absolutefor elements that don’t need to participate in flex calculations.
position: absolute elements are removed from the normal flow and computed separately, which can improve performance.Displaying
In this phase, we iterate the DOM tree and record high-level graphics commands for the elements that intersect some dirty region. The dirty regions are the places where the web page has changed and that have to be repainted. The regions can be visualized by pressing F3 in the Player or by enabling Paint flashing in the inspector.
The main marker here is Record Rendering. In there, we record buffers with rendering commands for the graphics library. The other markers during Displaying are only visible in L3. The most relevant marker is Draw Stacking Context. It shows the processing of an element that has established a stacking context. It is important to understand how a stacking context is established in an HTML page as non-stacking context elements are usually much faster to display. The Draw Stacking Context markers carry information about the DOM node in question and hovering them will highlight it in the viewport. Also, in the “Summary” panel there is again a path to the node in the “Elements” tab.
With L3 tracing of Displaying we can quickly identify hot spots and elements that take more amount of time to display. The markers in Record Rendering hence allow us to see which elements have the biggest performance burden.
General rules to follow when optimizing for Displaying
- Minimize changing regions on the screen – the more elements are changed, the more dirty regions there are, the more nodes have to be repainted. This affects the Record Rendering and has effects down the line for the rendering library.
- Minimize complex hierarchies of elements with lots of “layers”, clips (
clip-pathandoverflow: hidden), and gradients – DOM elements with lots of intricate features are harder to display and later render. Certain CSS properties necessitate the use of separate textures to render the content and then apply some effect on it. In such cases, we say that we require a new “layer”. Such properties arecolor-mix-mode,filter,backdrop-filter,opacity,isolation: isolate, andmask-image. Those should be used sparingly
Painting
The Paint marker shows what is going on during cohtml::ViewRenderer::Paint. Most of the time this is mainly calling the Cohtml’s rendering library – Renoir. There are, however, cases where there are a few more things. Most notably, in the first few frames of page loading, if there are some images to be uploaded to the GPU as textures, we can see their processing during the Paint. The notable markers are:
- Register Images In Renoir – Here the created images are submitted to the rendering library where some texture proxies are created. It’s important to note that here there is no interaction with the GPU. The existence of the images is merely communicated to Renoir.
- Create GPUImage Resources – This is when the image data is actually uploaded to the GPU and the GPU textures are created through the rendering backend. This happens in a call to Execute Backend Buffers which is a part of the rendering library
The other job of the Paint is to invoke the Renoir’s Frontend and Backend.
- Frontend – Renoir generates abstract rendering commands based on the recorded graphics commands during Record Rendering. Here there is no interaction with the graphics API. The marker contains information about the processed frontend commands.
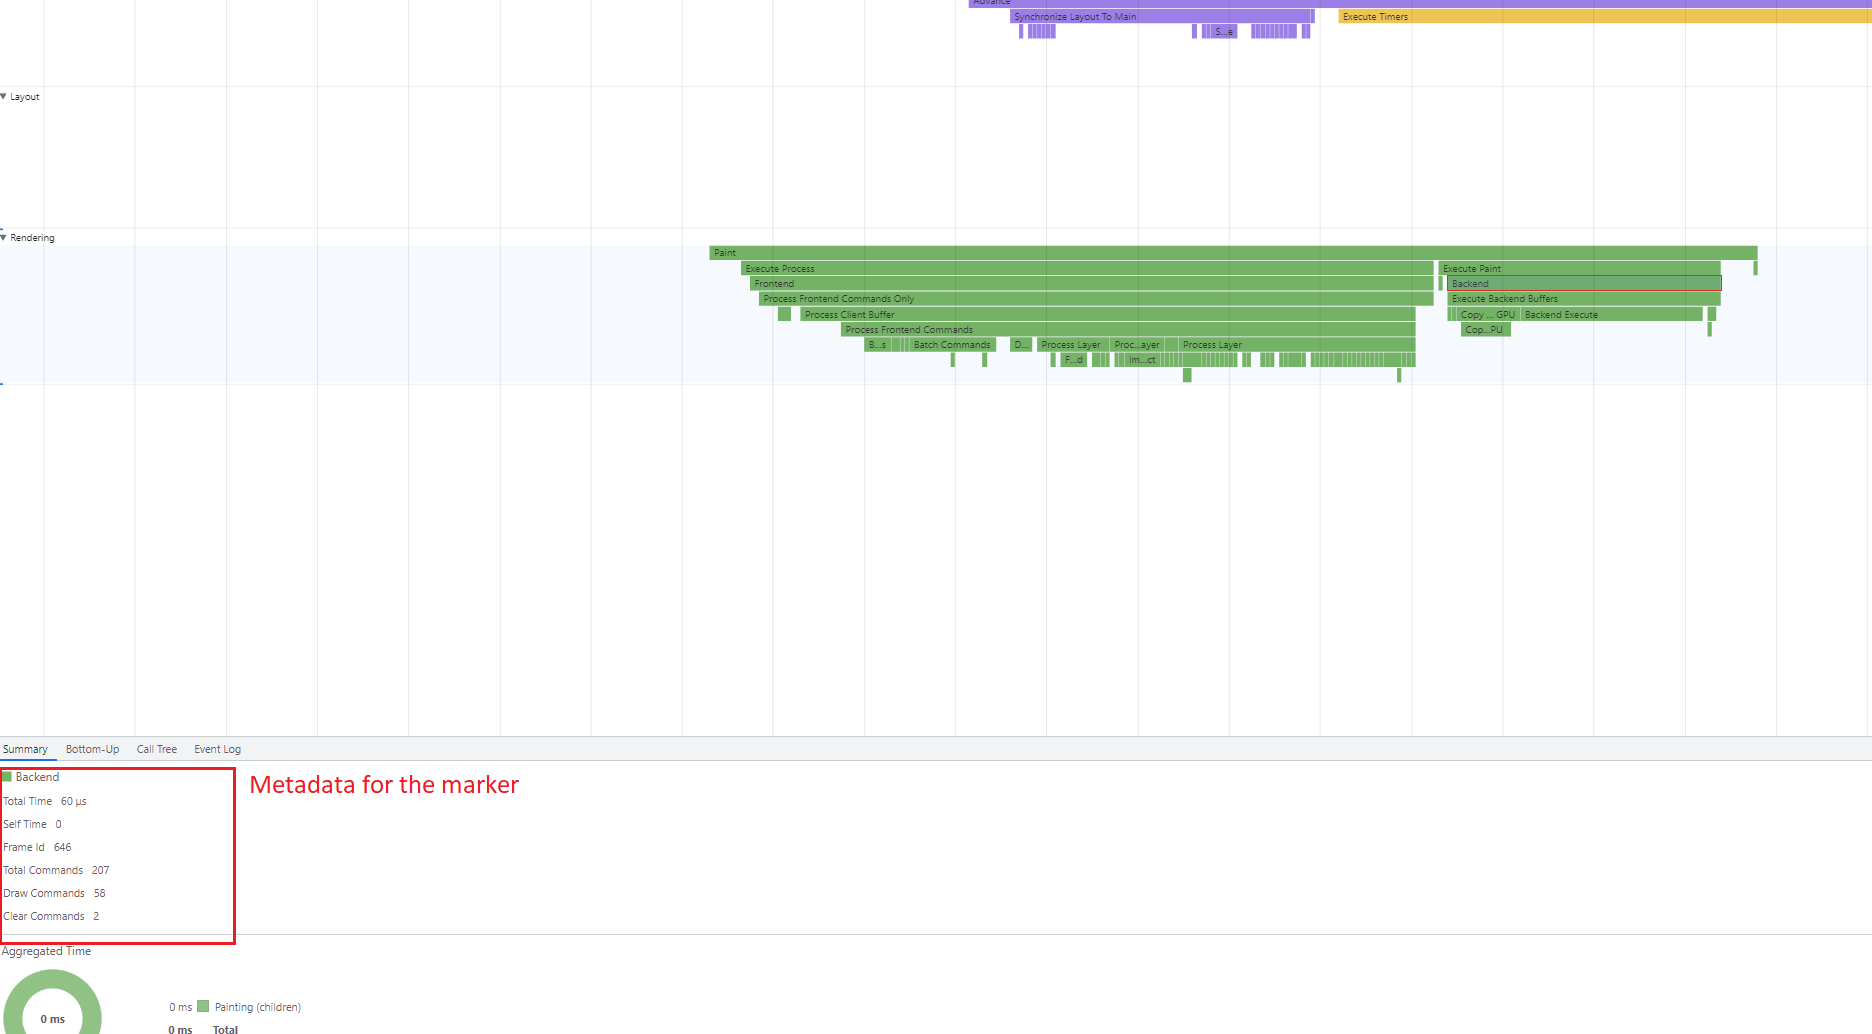
- Backend – uploading all needed resources to the GPU and executing the generated rendering commands through the rendering backends. This is where the interaction with the graphics API happens. The marker contains information about the generated backend commands.
General rules to follow when optimizing for Painting
- Minimize images that need to be uploaded to the GPU – creating and updating textures on the GPU is a slow operation. Preloading resources (see the documentation page) might be a good strategy for amortizing the cost of expensive GPU uploads.
Renoir Frontend and Renoir Backend
The last two phases are part of the Renoir rendering library. In these phases, we generate the final graphics API calls that will issue the draw calls that visualize the HTML page.
The Frontend processing happens by handling all of the generated command buffers during Record rendering. Generally, only a single command buffer is created for the DOM rendering. The marker for every command buffer is Process Client Buffer. The processing of the front-end commands happens in two large phases:
- For every layer in the command buffer we first batch the commands – Batch Commands – and figure out how to generate the least amount of draw calls.
- Then we process them – Process Layer – and we generate an abstract representation of draw calls and some geometry data.
Every Batch Commands and Process Layer marker is associated with a DOM element and hovering it will highlight this element. This gives the ability to link rendering commands to the exact element in the DOM that has generated them.
In L3 tracing we even have access to the individual commands processed during Process Layer. We can see how an element is rendered with rectangles, circles, ellipses, etc. The application of effects on layers happens during markers like Draw Sub Layer, Draw Sub Layer With Shader Filter, and Draw Sub Layer With Shader Blend Mode.
Renoir is also responsible for tessellating and generating the geometry for the path objects that should be rendered. Path tessellation is a heavy operation and Renoir tries to cache tessellations as much as possible. The markers to watch out for are Fetch Tessellated Path and Tessellate Path.
- Fetch Tessellated Path shows when Renoir is trying to find a tessellation for a given path and reuse it.
- Tessellate Path shows when an appropriate tessellation was not found and tessellating and geometry generation is required.
General rules to follow when optimizing for Renoir Frontend
- Use texture atlases – Renoir can batch drawing images only if they are in the same GPU texture. See the page on the Atlas Creator tool for more information on how to achieve image atlasing.
- Minimize elements that require layers – Renoir needs to allocate extra GPU textures for layers. Also, the rendering of some effects like blur requires at least two more GPU textures. There is also the cost of doing render target switching
- Minimize path elements that change every frame and require re-tessellation – re-tessellating paths is required when a path has to be drawn with a different scale than the one it was previously drawn with. This can happen when a path is animated for example.
The work in the Backend marker is largely dependent on what has happened in the Frontend. The main tasks here are the copying of all geometry data to the GPU, the creation of relevant GPU resources (textures, index, constant, and vertex buffers), and the execution of the GPU commands generated during Frontend
- Copy Geometry Data To GPU is when all of the vertices and indices are generated straight into staging buffers that are copied to the GPU. Expect this marker to get bigger the more drawing commands there are.
- Backend Execute Resource Commands is a marker for when Renoir has to create some resources on the GPU. This can be seen most clearly when some images are uploaded to the GPU.
- Backend Execute is for when RendererBackend::ExecuteRendering is called and the draw calls are submitted to the graphics API.
Optimizing for Renoir Frontend is the same as optimizing for Renoir Frontend
Markers overview
Always enabled markers:
- Advance – traces the call to
cohtml::View::Advance - RecalculateStyles – traces solve of the CSS styles in the DOM tree
- UpdateMainLayoutTree – traces the updating of layout properties in the layout tree
- ExecuteTimers – traces the JavaScript execution of events, timers and
requestAnimationFrames - ExecuteScript – traces the JavaScript execution of script files loaded in the DOM
- SynchronizeModels – traces the call to
cohtml::View::SynchronizeModels - OnLoadEvent – traces when
window.onloadevent happens - Layout – traces the main work on the layout thread
- UpdateNodeTransforms – traces the lightweight layout solve
- ImmediateLayout – traces when layout should happen on the UI thread due to some JavaScript call
- Paint – traces the call to
cohtml::ViewRenderer::Paint - RecalcVisualStyle – traces the updating of visual styles of DOM nodes affected by the previous layout
- RecordRendering – traces the recording of graphics commands for every DOM node that has to be painted
- ExecutePaint – traces the frontend execution of Renoir
- ExecuteProcess – traces the backend execution of Renoir
- WaitPendingFrame – traces the wait for the layout work finish of the previous frame
Advance markers
- StyleSolveFull – traces when a full CSS style solve for the whole DOM tree is performed
- StyleSolvePartial – traces the style solve when only certain DOM nodes need to have their CSS styles resolved
- StyleSolveAfterAnimations – traces style solve when there are animation properties changed for some elements
- ResolveNodeStyles – traces when individual DOM nodes have their styles resolved
ResourceLoading markers
- BuildSVG – traces when the SVG DOM is created for any non-inline SVG
- IterateDOMBuilding – traces when part of the DOM tree is being built. This happens when a URL is loaded.
Laoyut markers
- SolveFlexLayout – traces the heavyweight layout solve of the whole layout tree
- FlexLayoutImpl – traces the calls to the layout engine
- RecursiveTransformNodes – traces the transformation solving of layout nodes that have been affected by the last layout
- SynchronizeLayoutToMain – traces the sync of the changed layout nodes with the DOM tree.
- SynchronizeNode – traces the sync of an individual layout node with its DOM node counterpart.
Displaying markers
- DrawStackingContext – traces the recording of graphics command for a single element that establishes stacking context in the DOM tree.
Painting markers
- FreeGPUTextures – traces the upload of GPU textures
- RegisterImagesInRenoir – traces the submission of images to the rendering library
- FreeRenderingResources – traces the destruction of certain GPU resources when calling
cohtml::ViewRenderer::FreeRenderingResources - CreateGPUImageResources – traces the upload of images to the GPU as textures
RenoirFrontend markers
- ProcessClientBuffer – traces the processing of command buffers with graphics command in Renoir.
- ProcessResourceCommands – traces the processing of resource commands for a command buffer. These are mostly texture creations and updates
- BatchCommands – traces the batching of graphics commands and their coalescing into batches where each batch is roughly one draw call.
- ProcessLayer – traces the processing of layer that was generated during
RecordRendering. - FetchTessellatedPath – traces the finding or creating of an appropriate tessellation for a path object.
- TessellatePath – traces the tessellation and generation of geometry data for a path object
- BlurRenderTarget – traces the generation of backend commands for a layer that has to be drawn blurred.
- DrawSubLayerWithShaderFilter – traces the generation of backend commands for a layer that has to be drawn with some effects from the
filterCSS property. - DrawSubLayerWithShaderBlendMode – traces the generation of backend commands for a layer that has to be drawn with a custom blend mode based on the
mix-blend-modeCSS property. - DrawFillRectShaderAndMask – traces the generation of backend commands for a special command used mostly for drawing gradients
- ProcessSimpleSublayer – traces the processing of a simple sublayer. Simple sublayers contain only a draw image command and the extra textures that are usually needed for the layer can be avoided.
RenoirBackend markers
- PrepareGlyphGPUResources – traces the processing of resources needed for glyph generation (updating texture and buffers)
- ExecuteGlyphResourceCommands – traces the creation of GPU resources needed for the rendering of SDF glyphs in glyph atlases.
- CopyGlyphGeometryDataToGPU – traces the generation of geometry data in staging buffers that are copied to the GPU. This is the call to
RendererBackend::ExecuteRendering - BackendExecute – traces the execution of the backend rendering commands through the rendering backend. This is the call to
RendererBackend::ExecuteResourceCommands - BackendExecuteResourceCommands – traces the execution of the backend resource commands through the rendering backend.
- CopyTesseletionsDataToGPU - traces the upload of geometry data for path objects to the GPU.
- CopyGeometryDataToGPU – traces the generation of geometry data for all rendering commands in stating buffers that will be copied to the GPU.